L19: Combining Vectors and Rasters
Grids, Zonal Stats, Count by Polygons
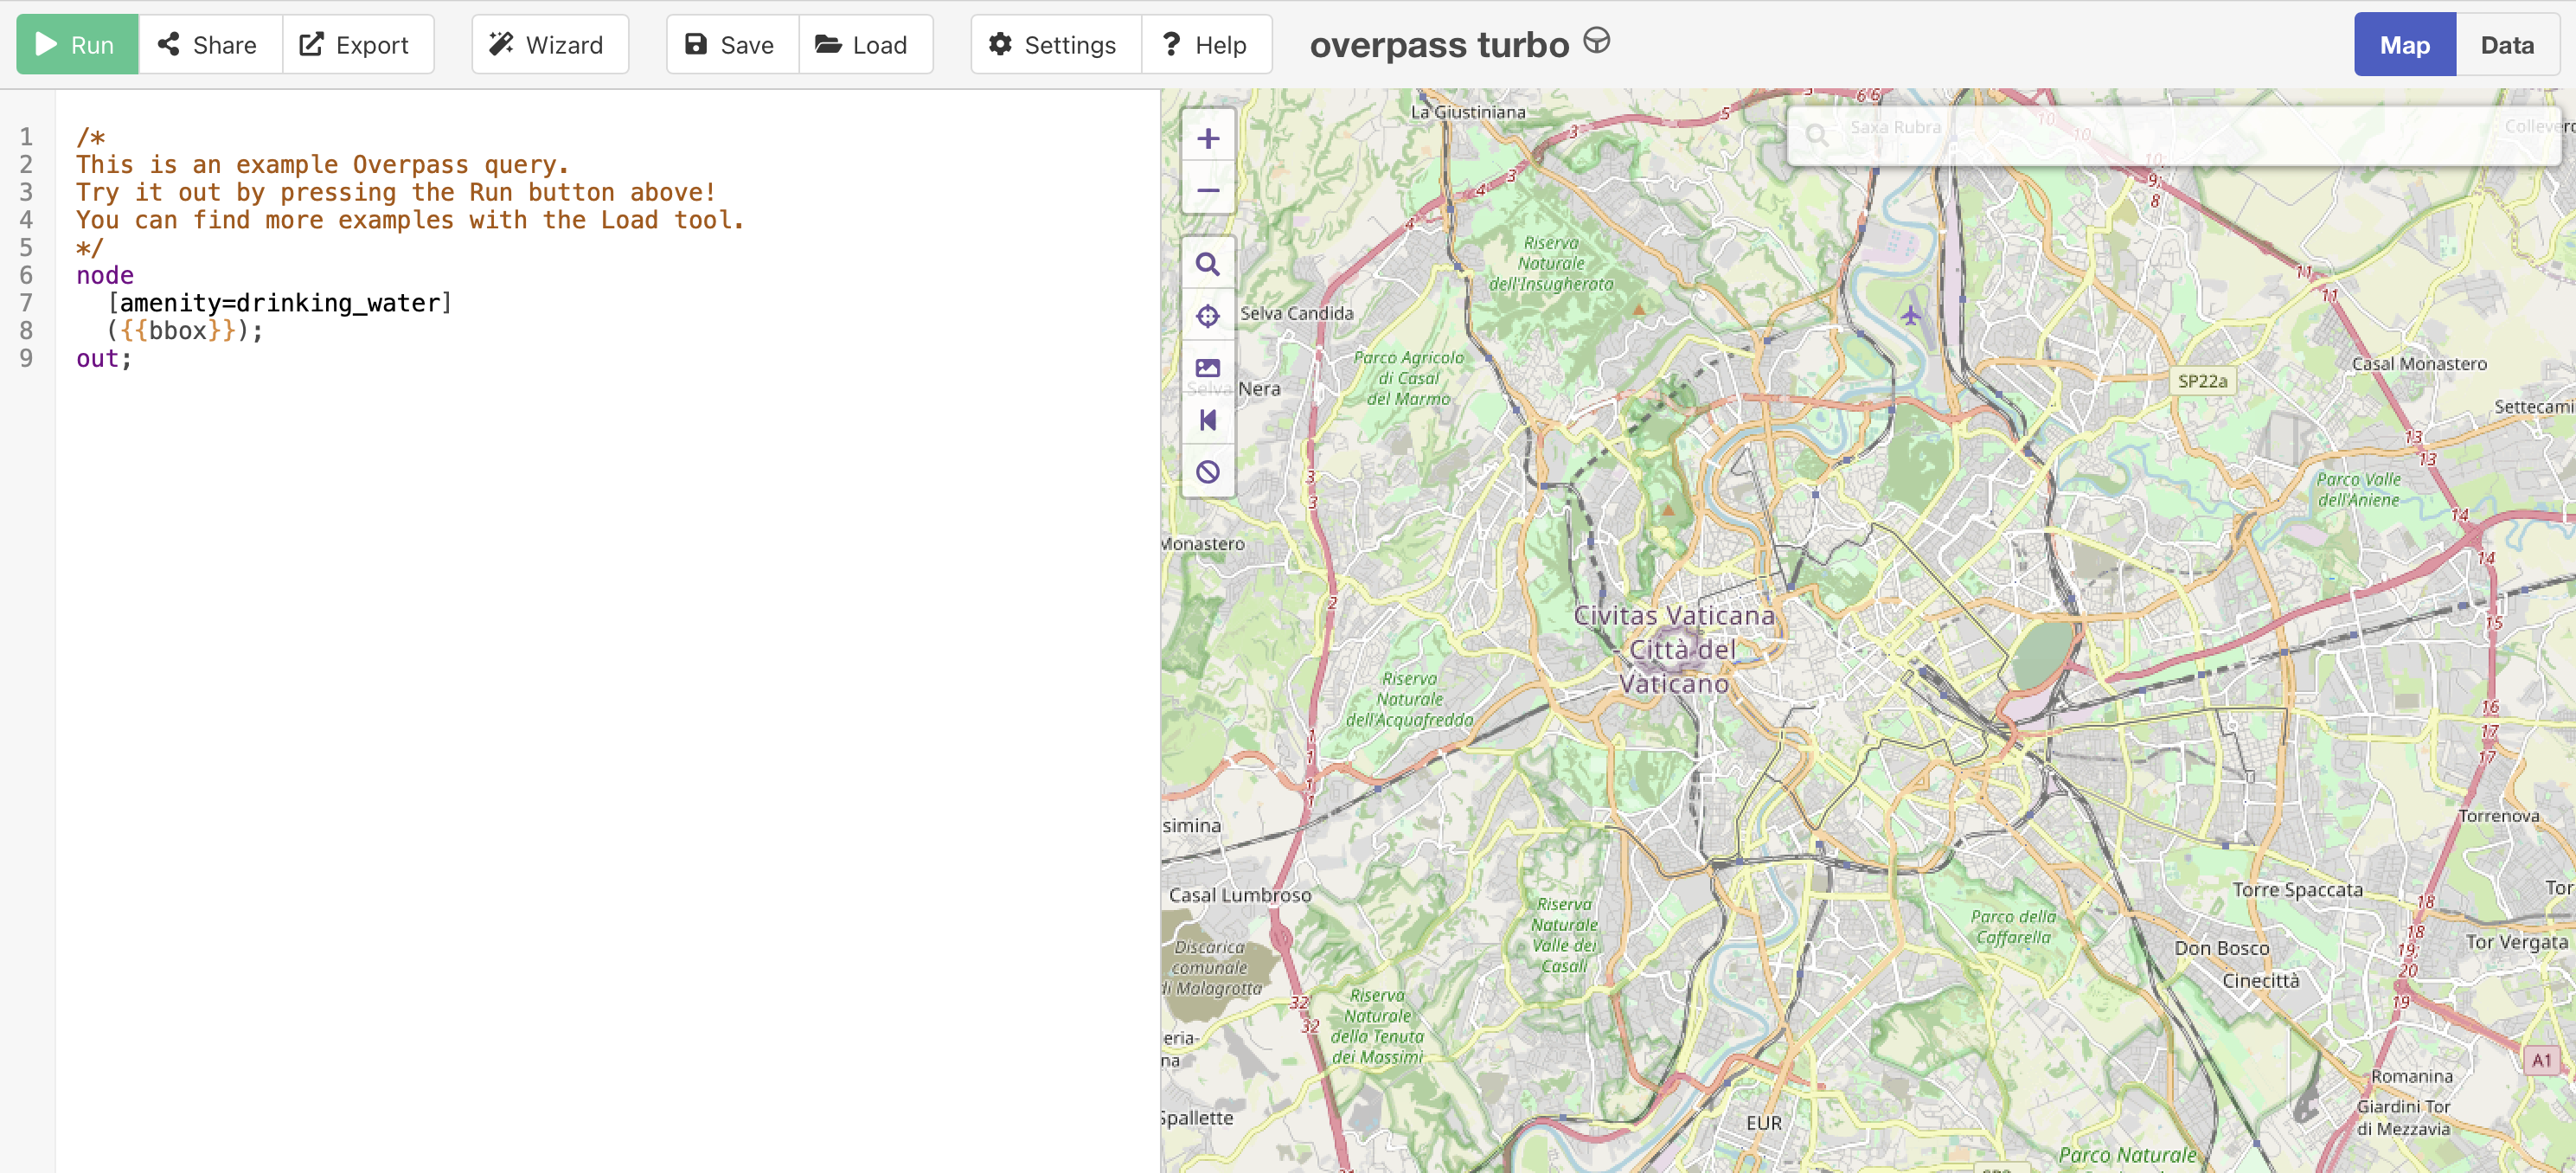
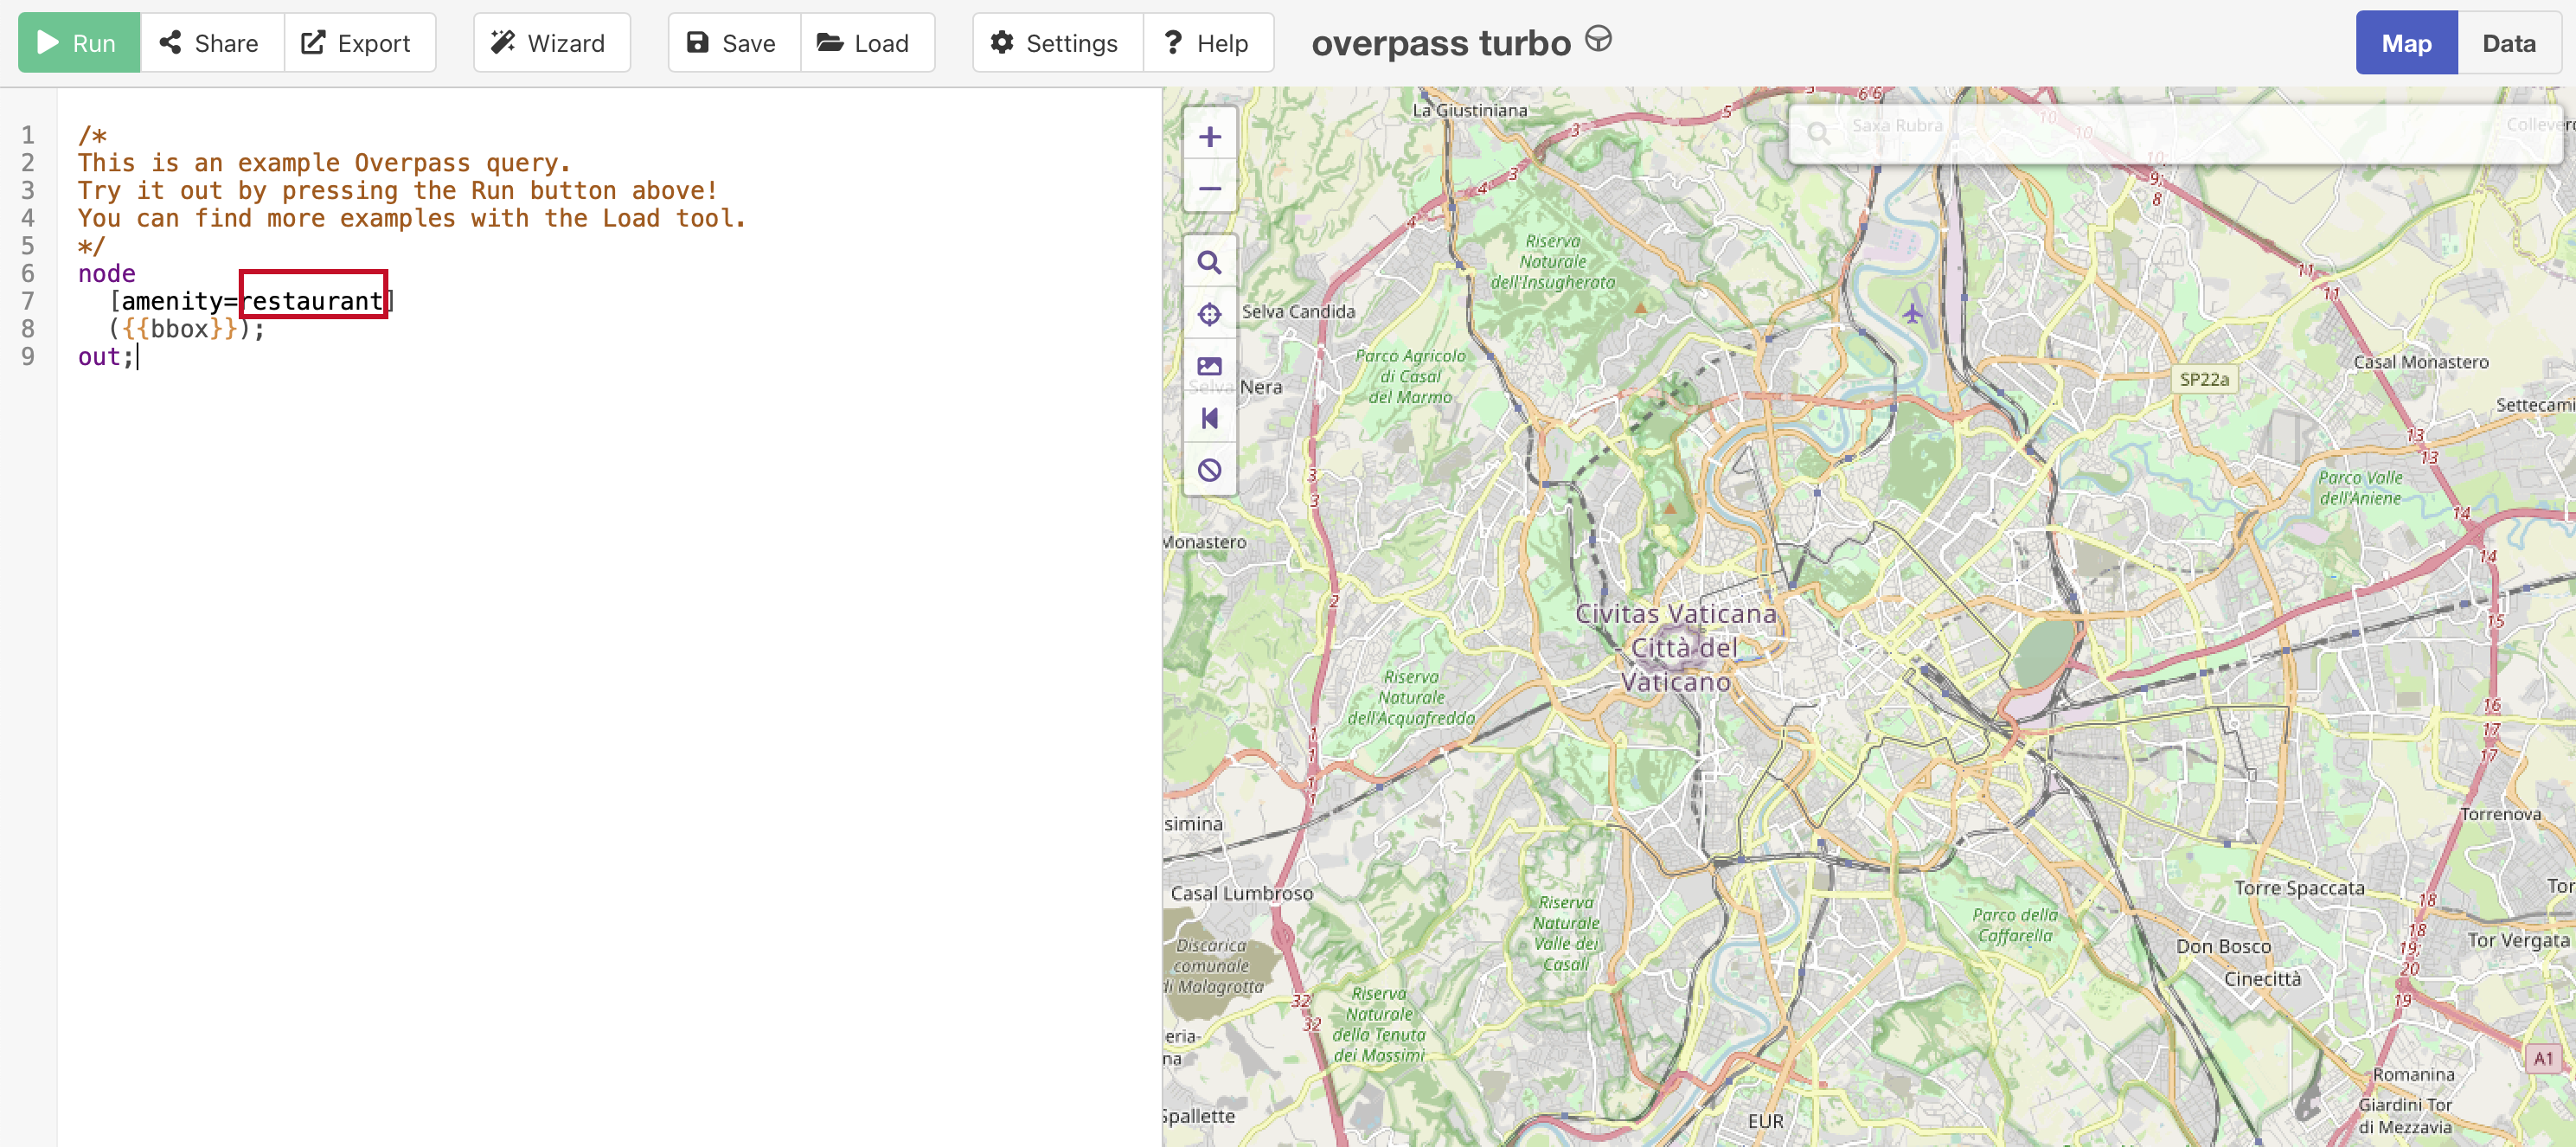
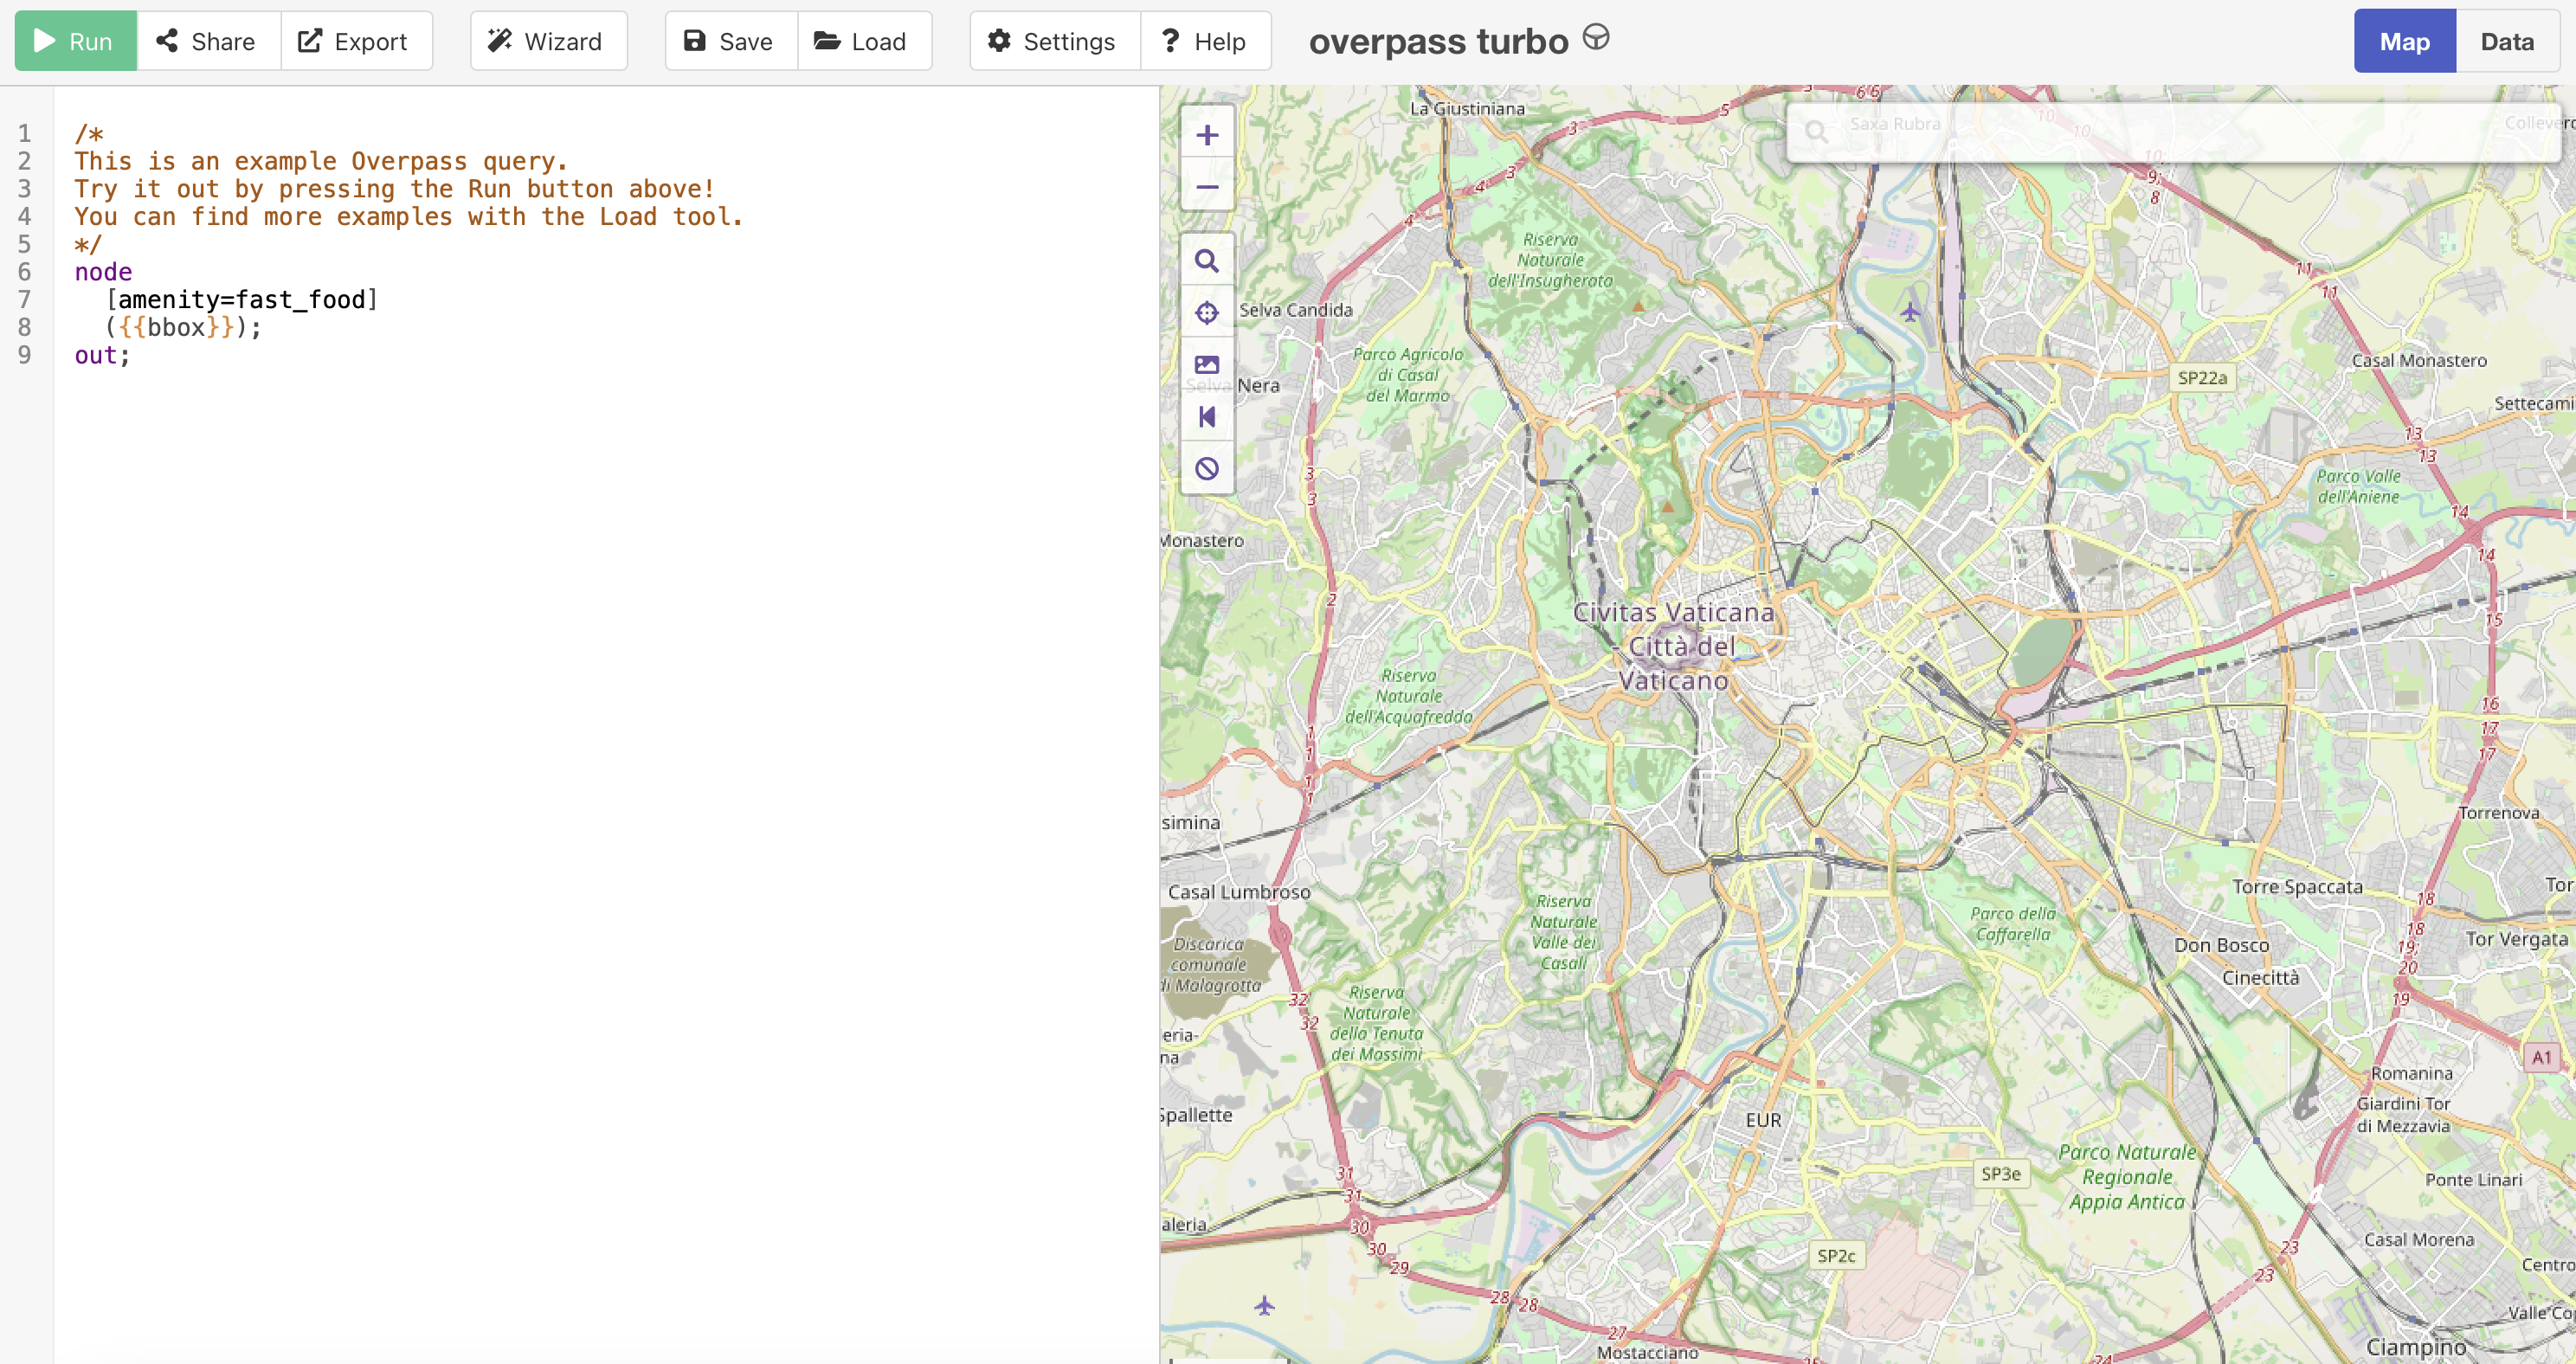
The Data: Overpass-turbo.eu
This is what https:/overpass-turbo.eu/ looks like (2023/11/20).
The Data: Restaurants
We first zoom into the relevant area.
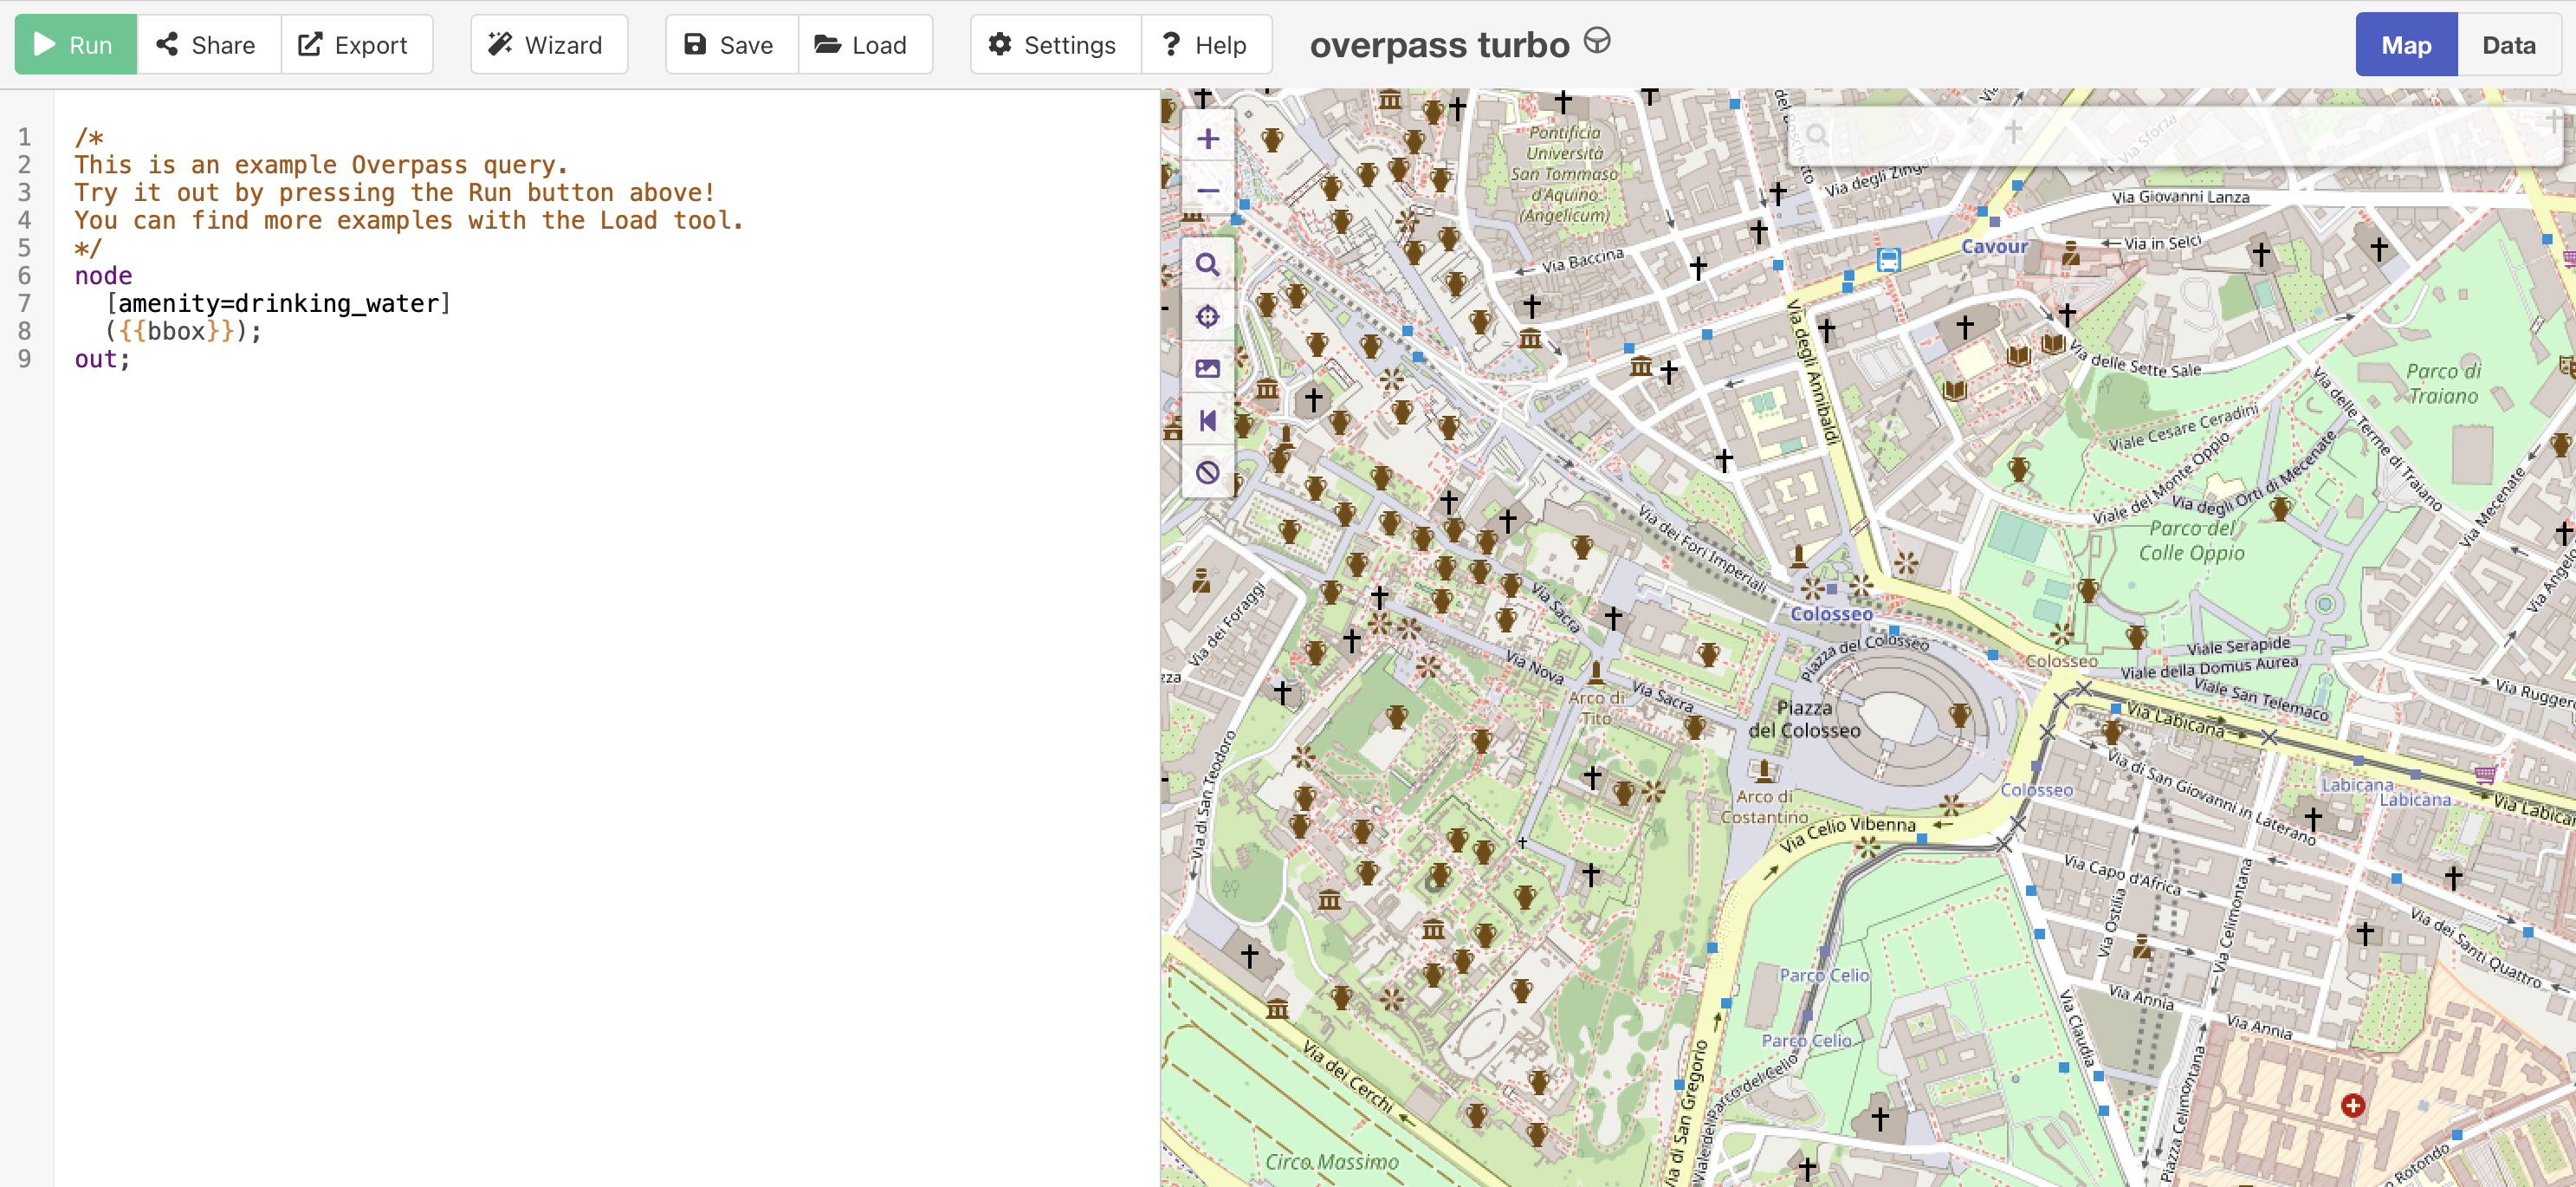
The Data: Restaurants
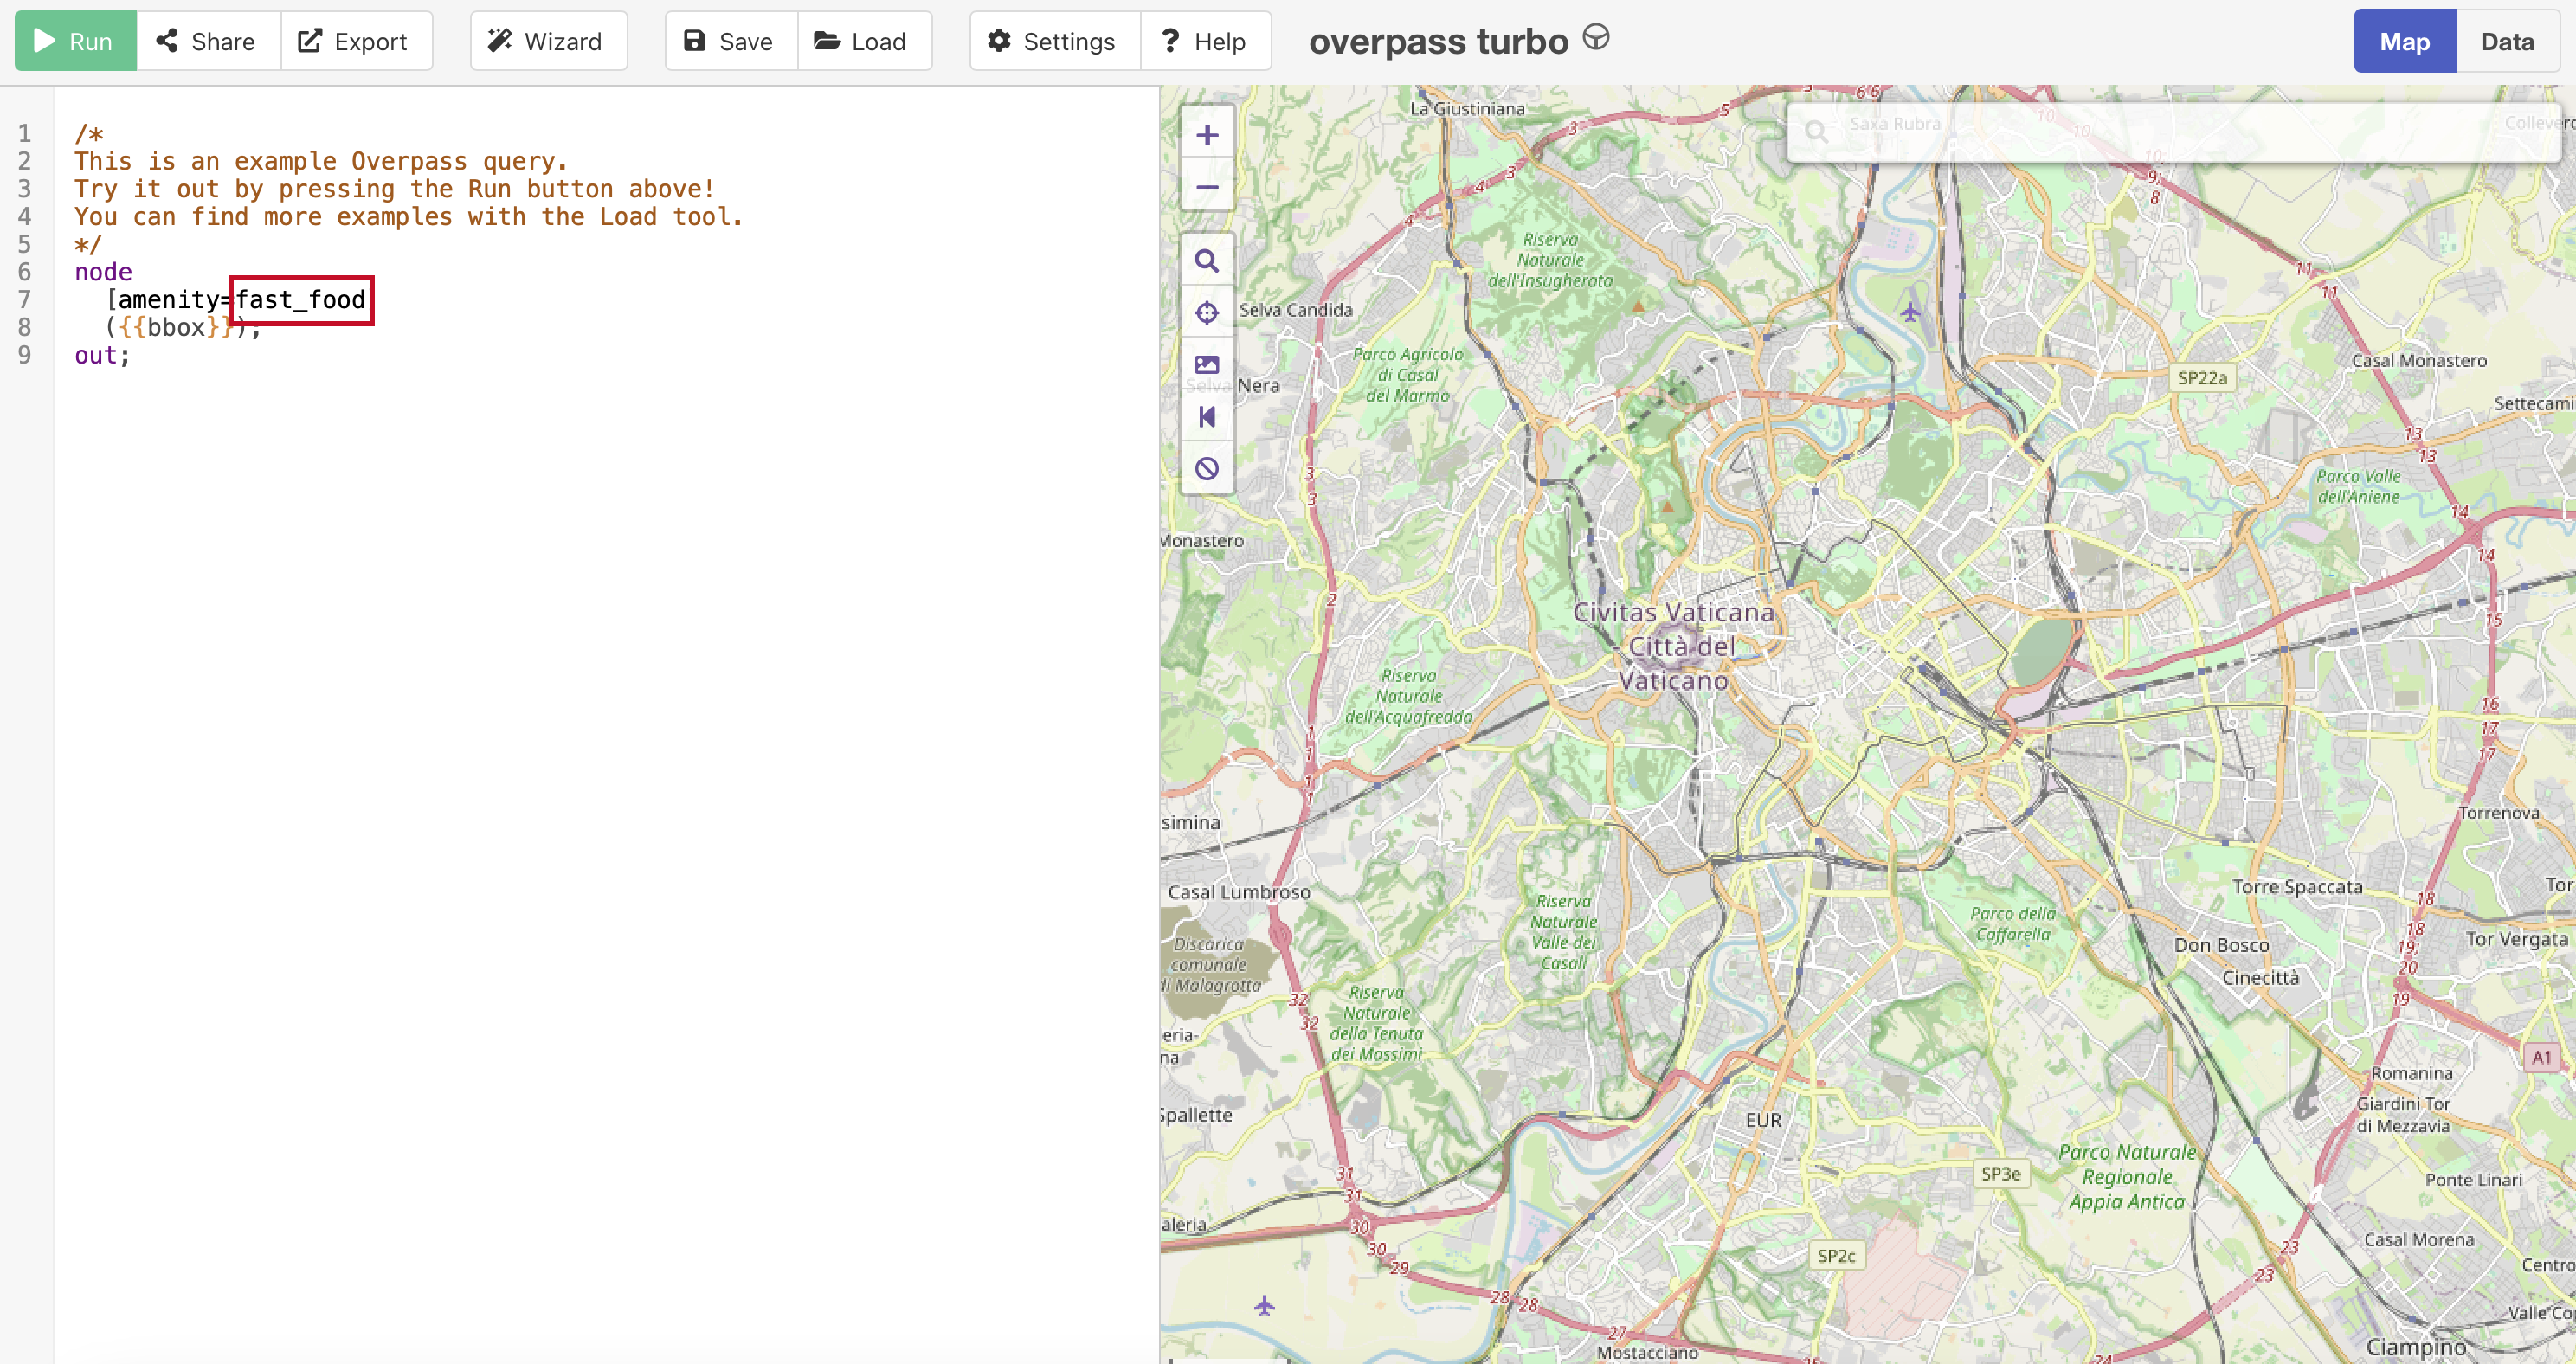
We then search for the relevant amenity: “restaurant”.
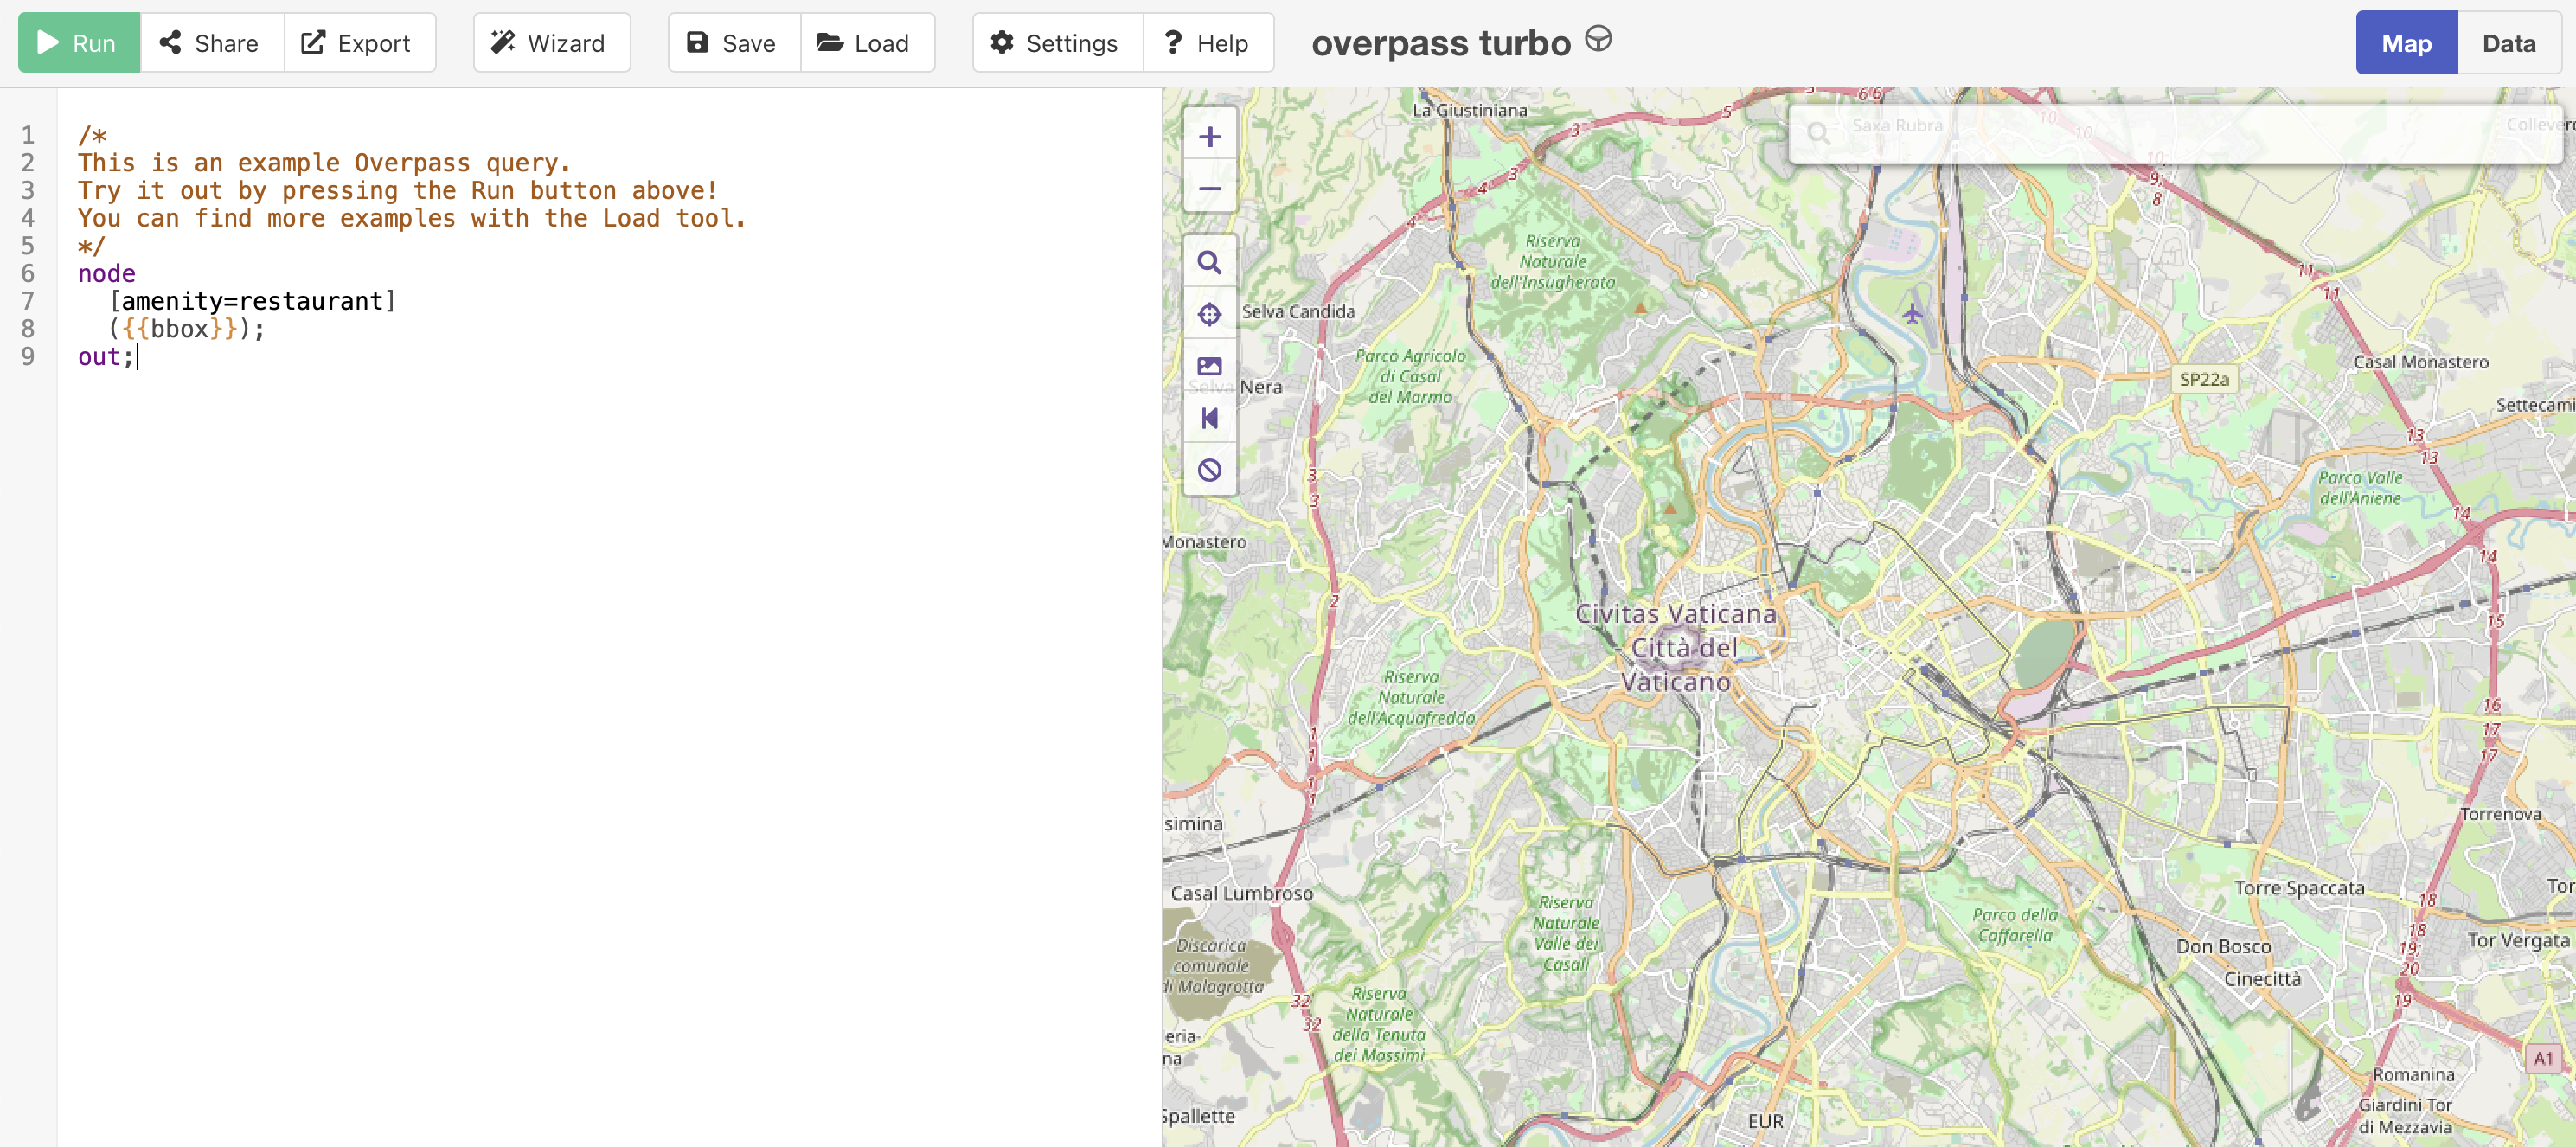
The Data: Restaurants
We then search for the relevant amenity: “restaurant”.
The Data: Restaurants
We then search for the relevant amenity: “restaurant”.
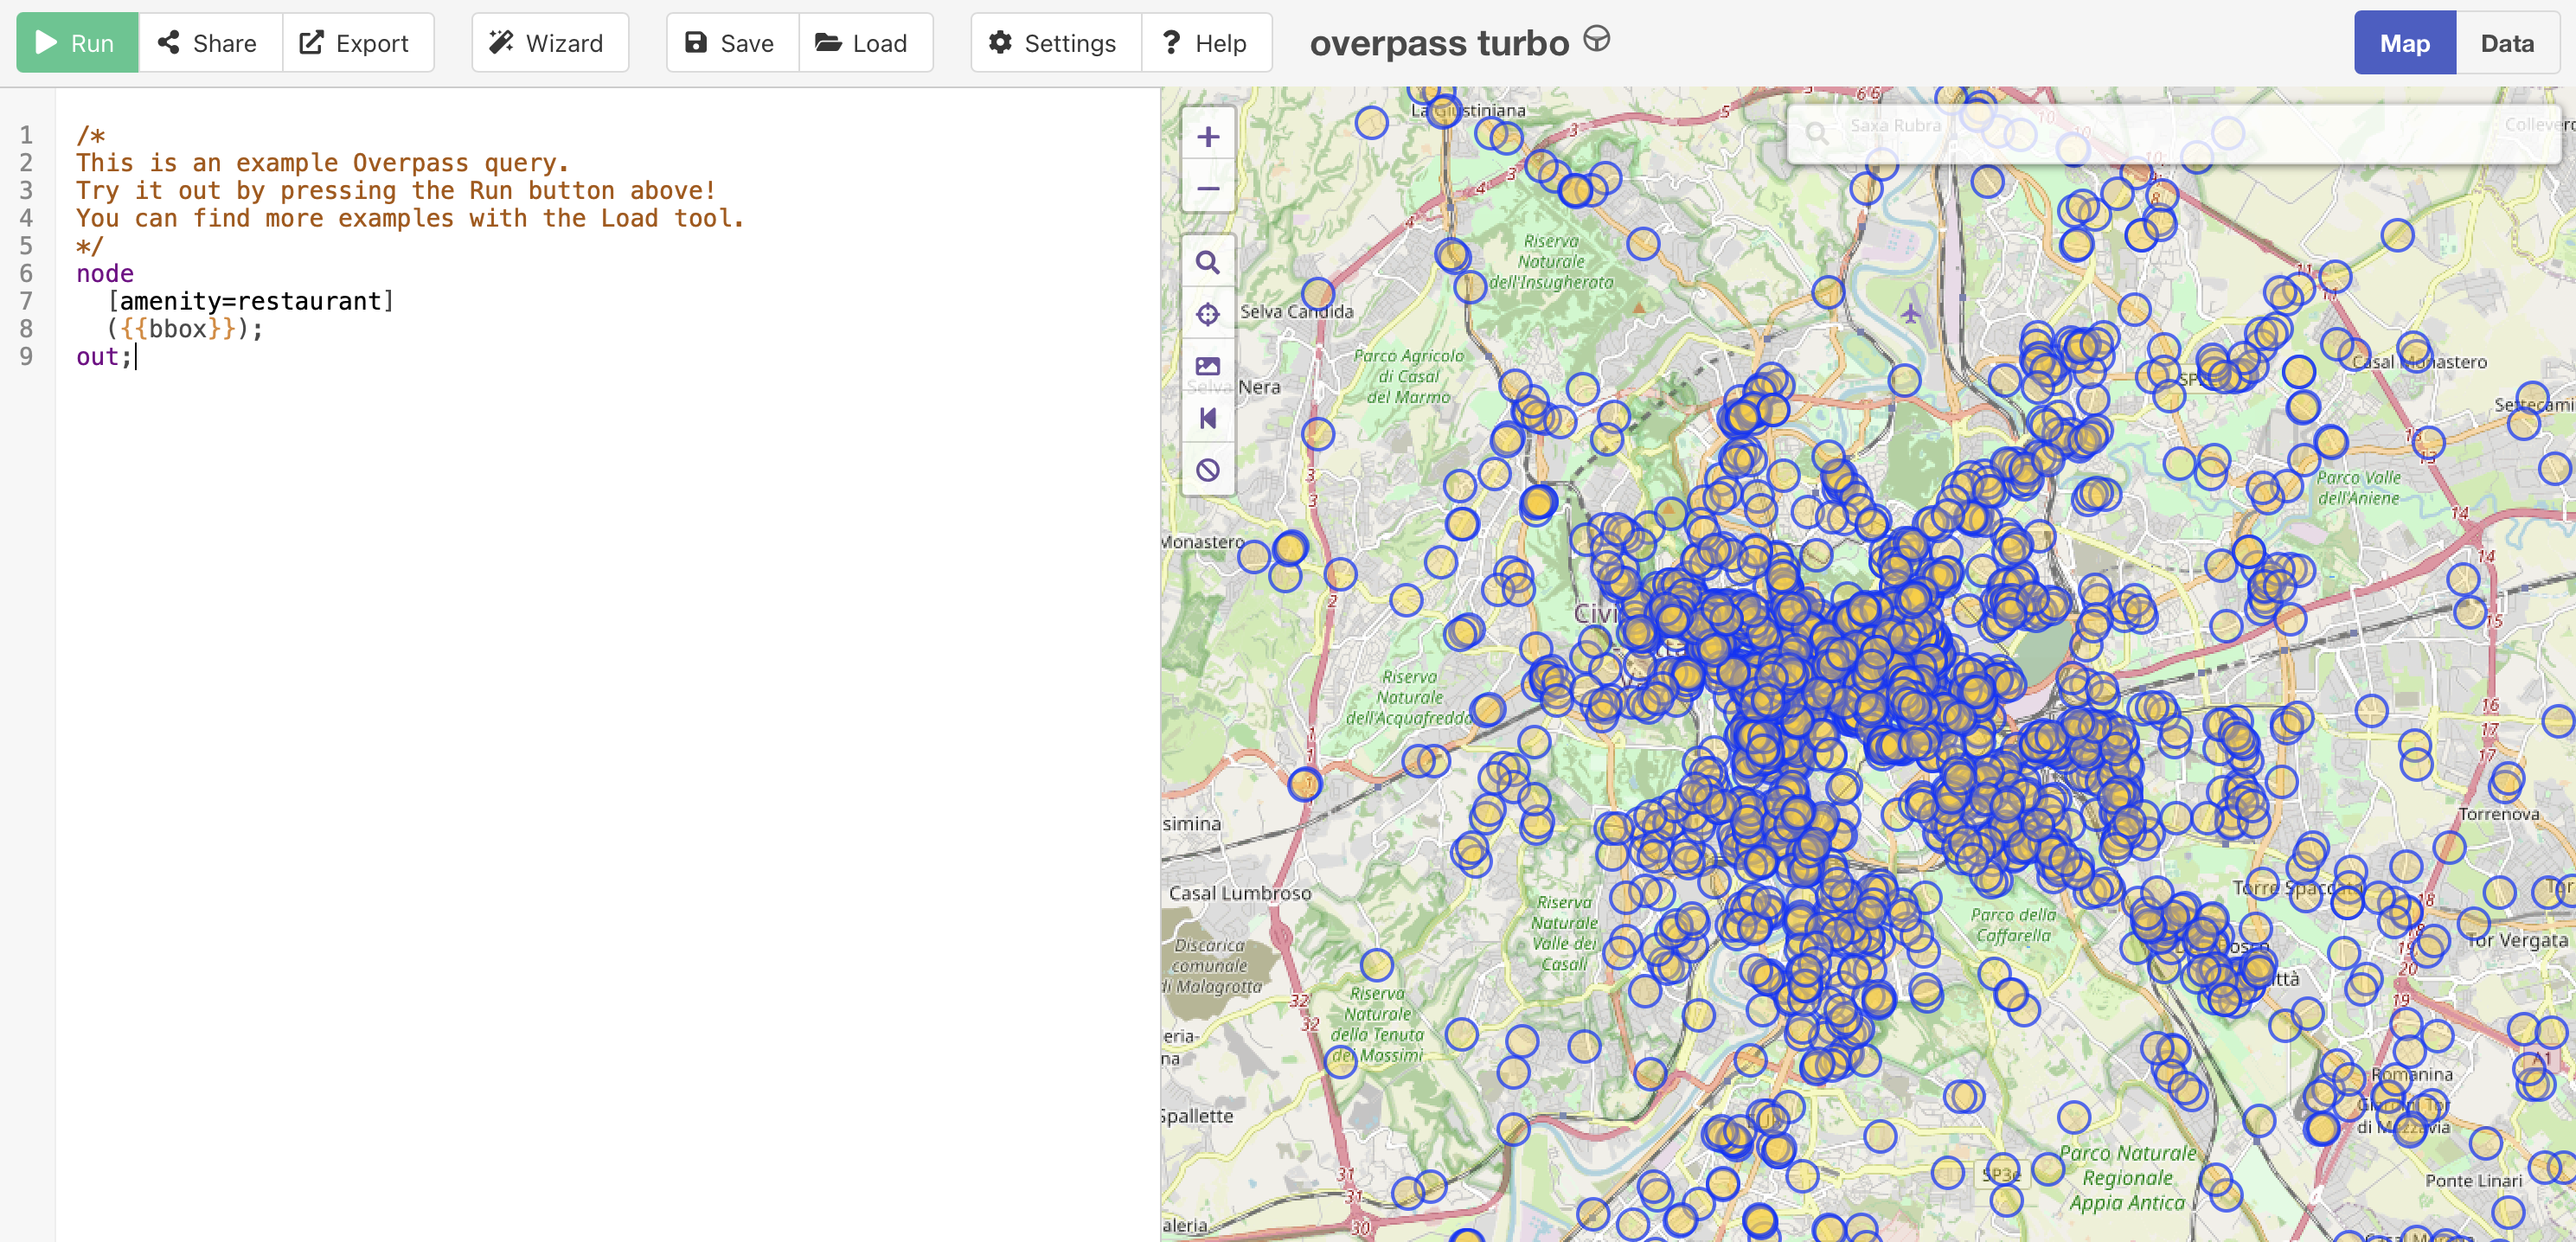
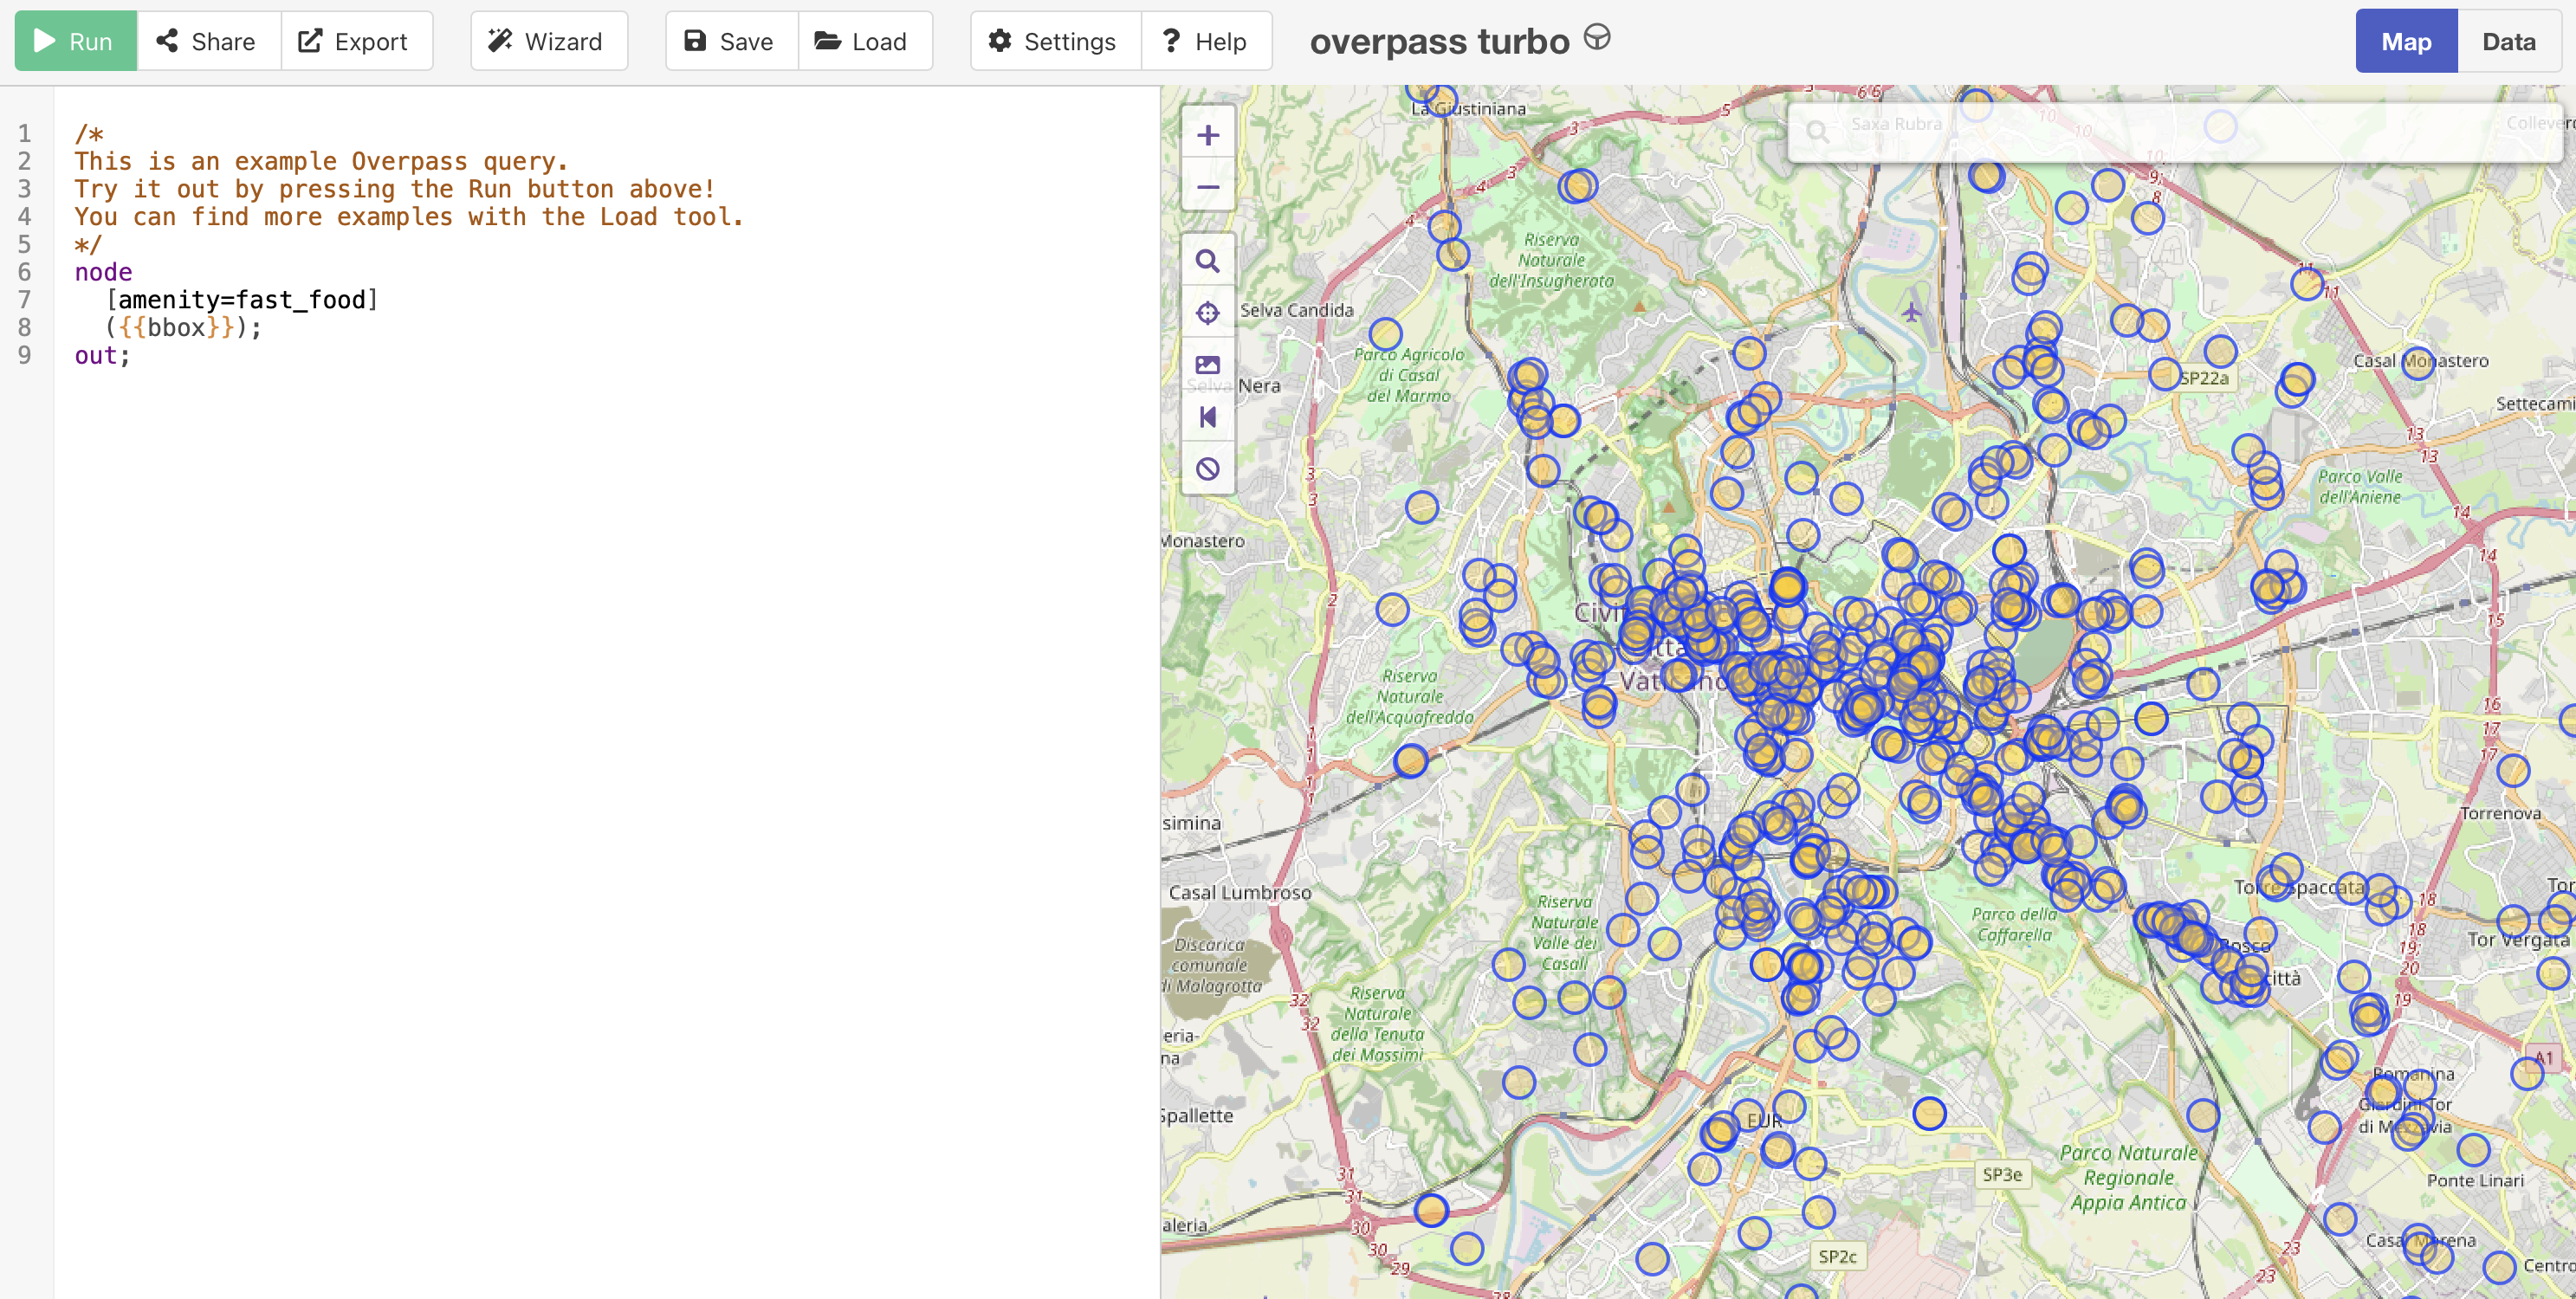
We then press “Run”.
The Data: Restaurants
We now see all the restaurant within the relevant area (that we zommed onto).
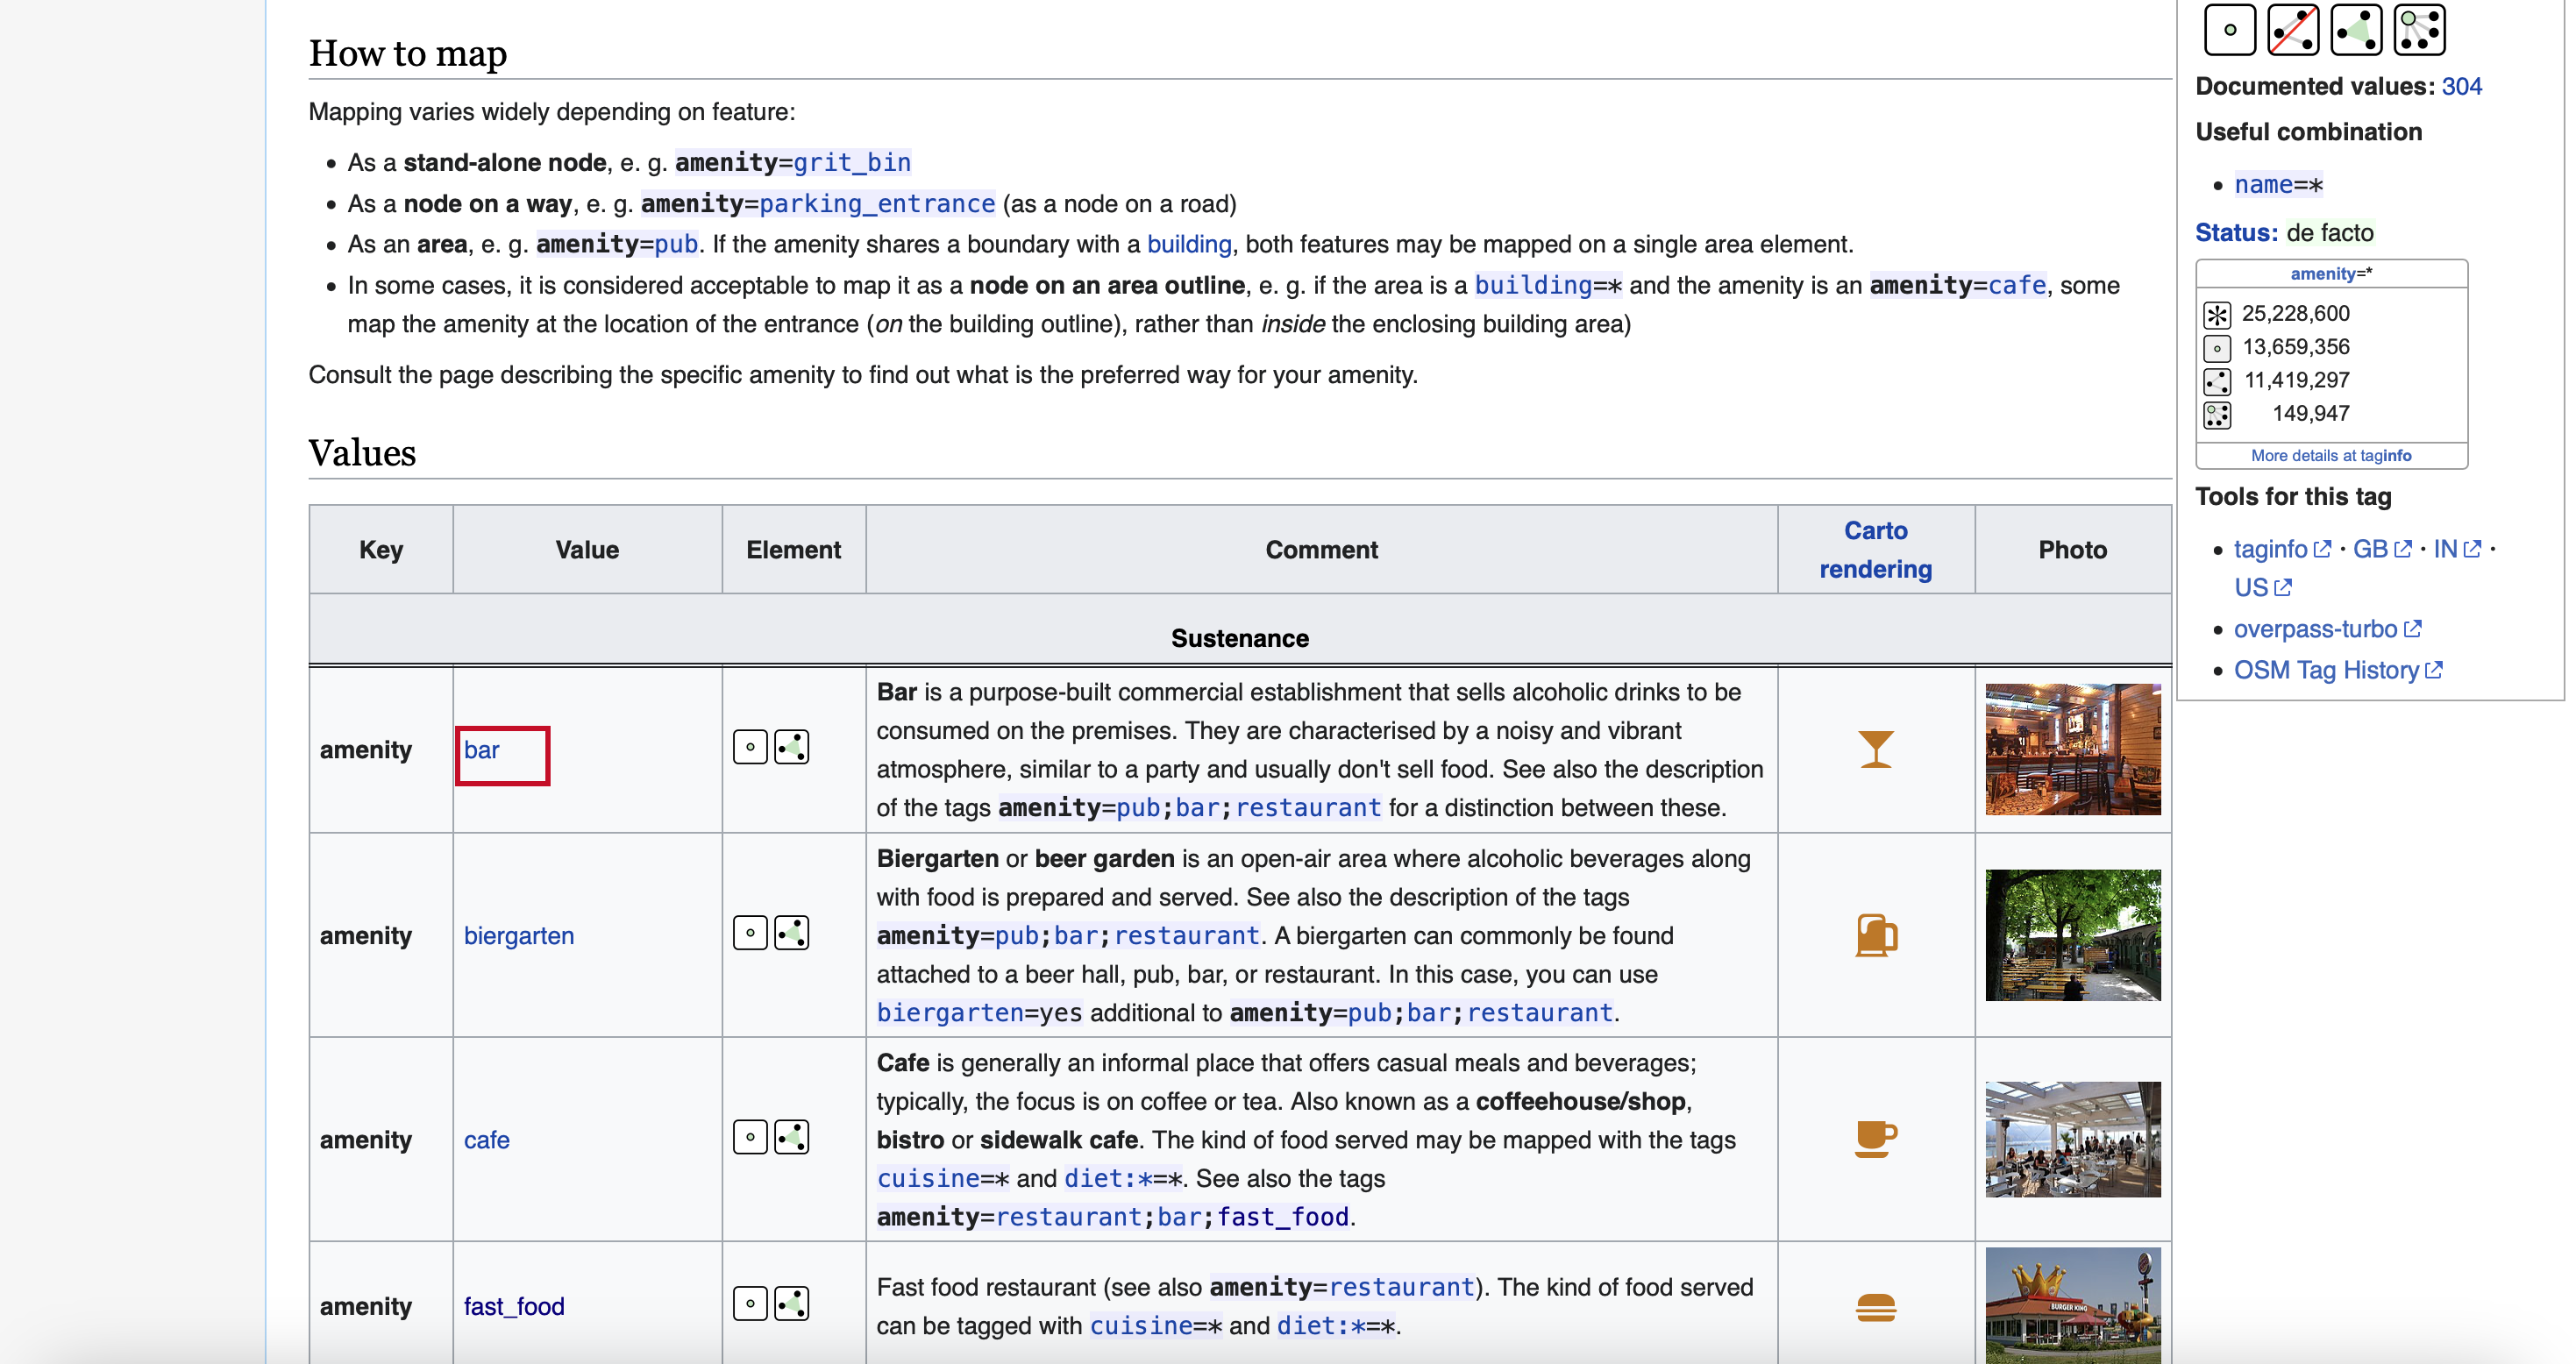
How do we know what to Search For?
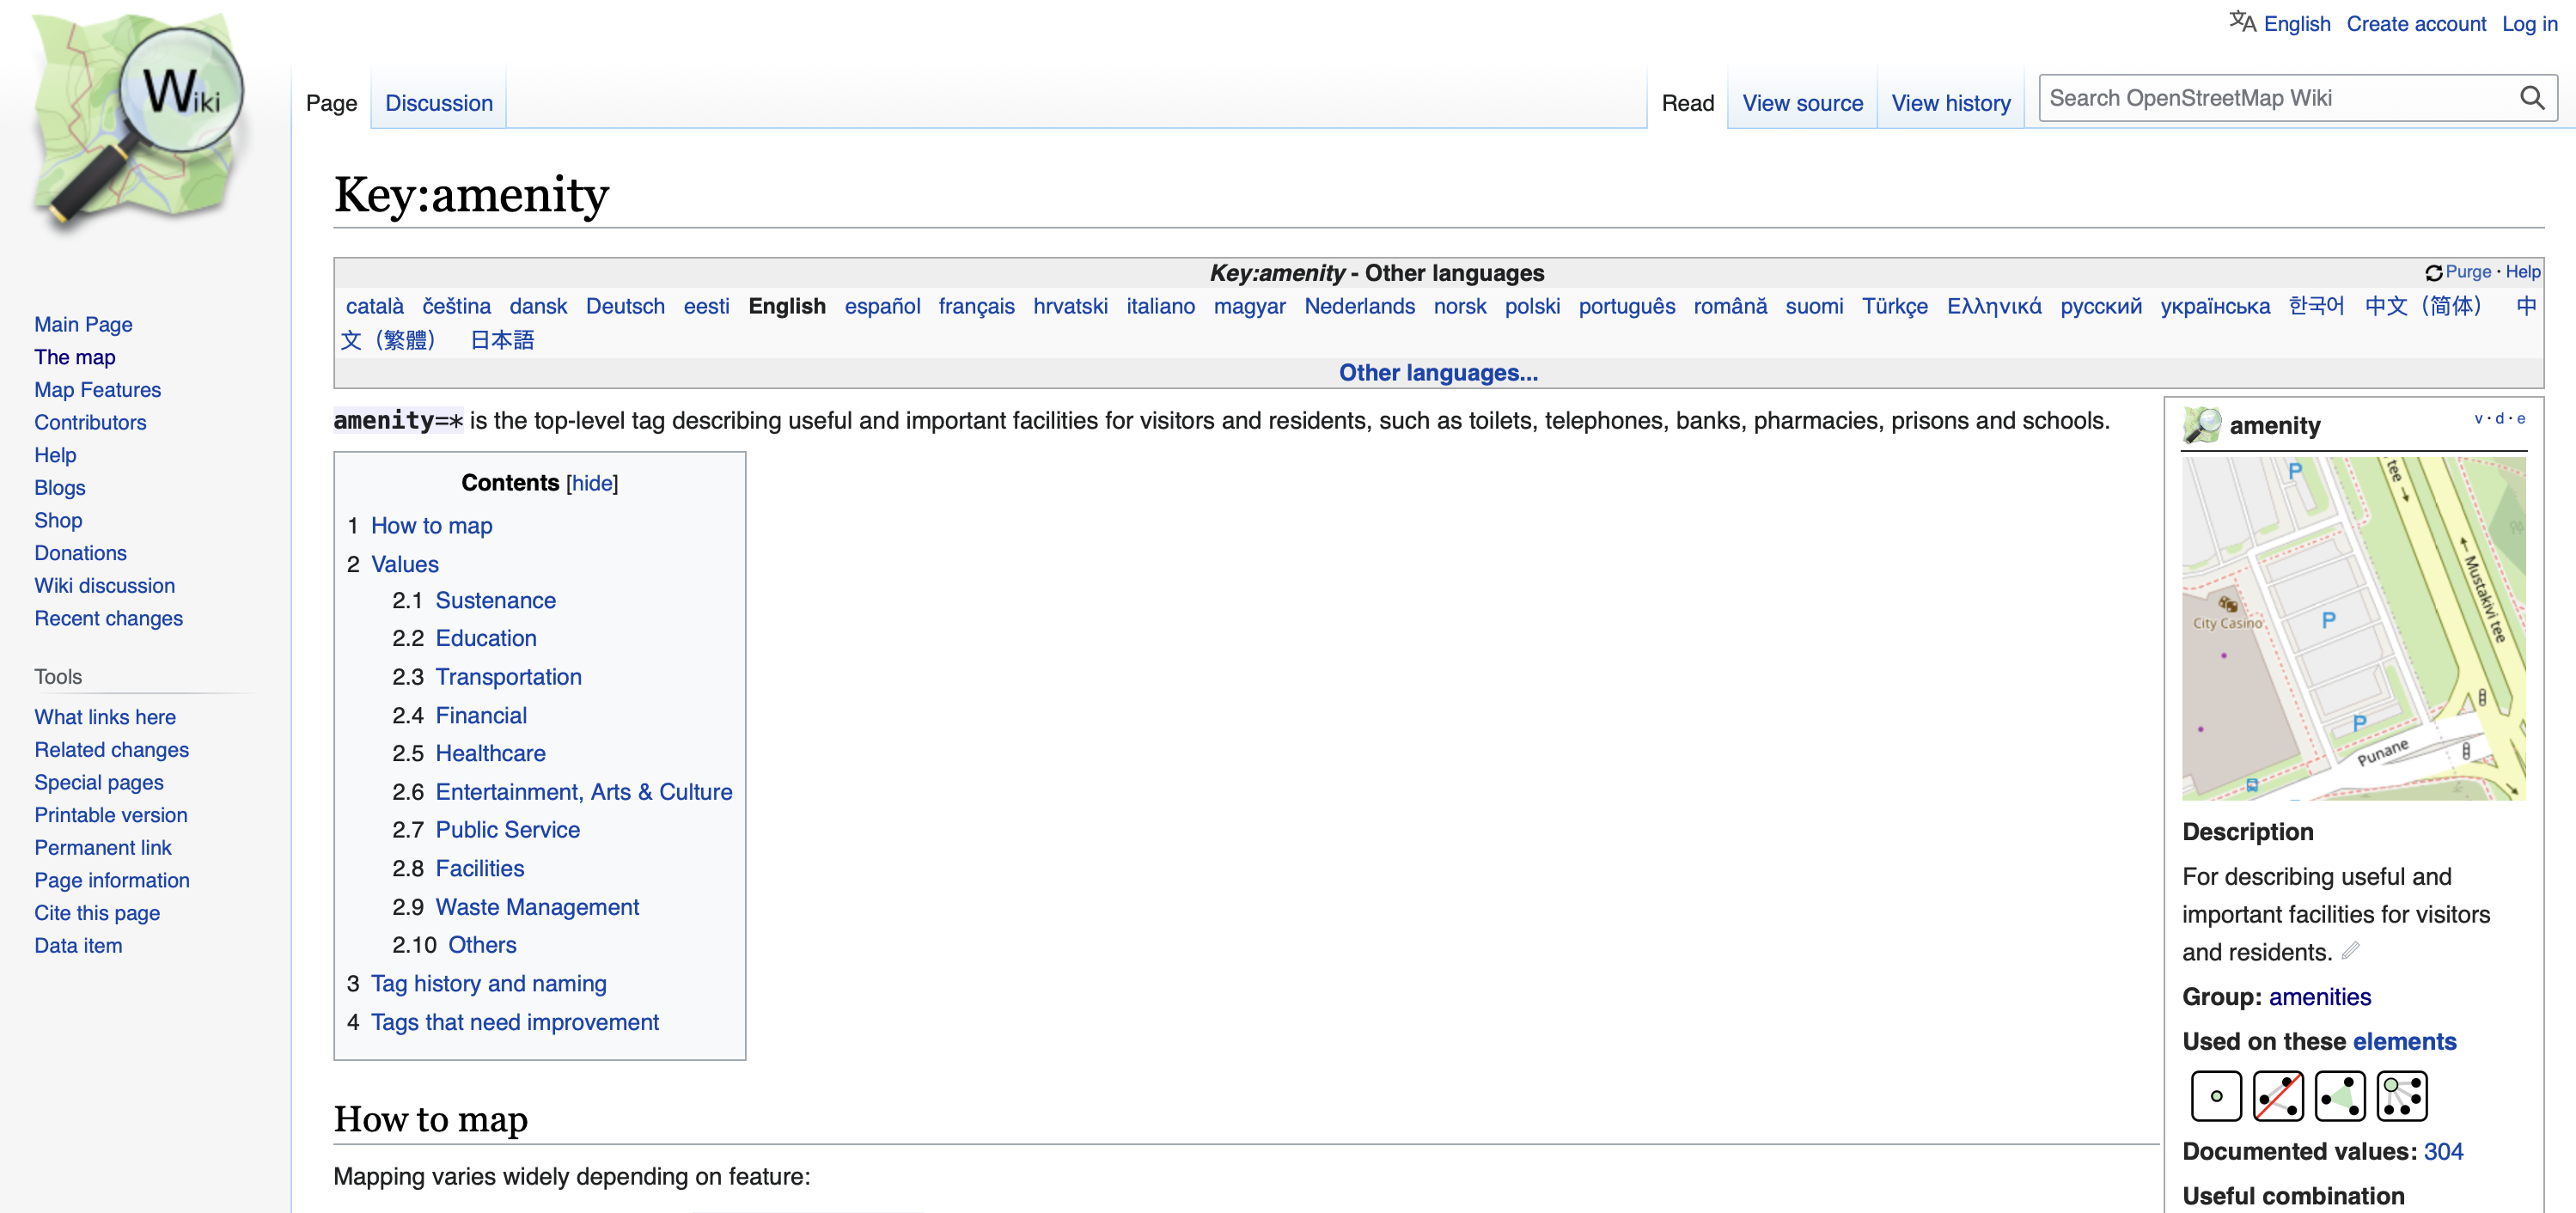
How do we know what to Search For?
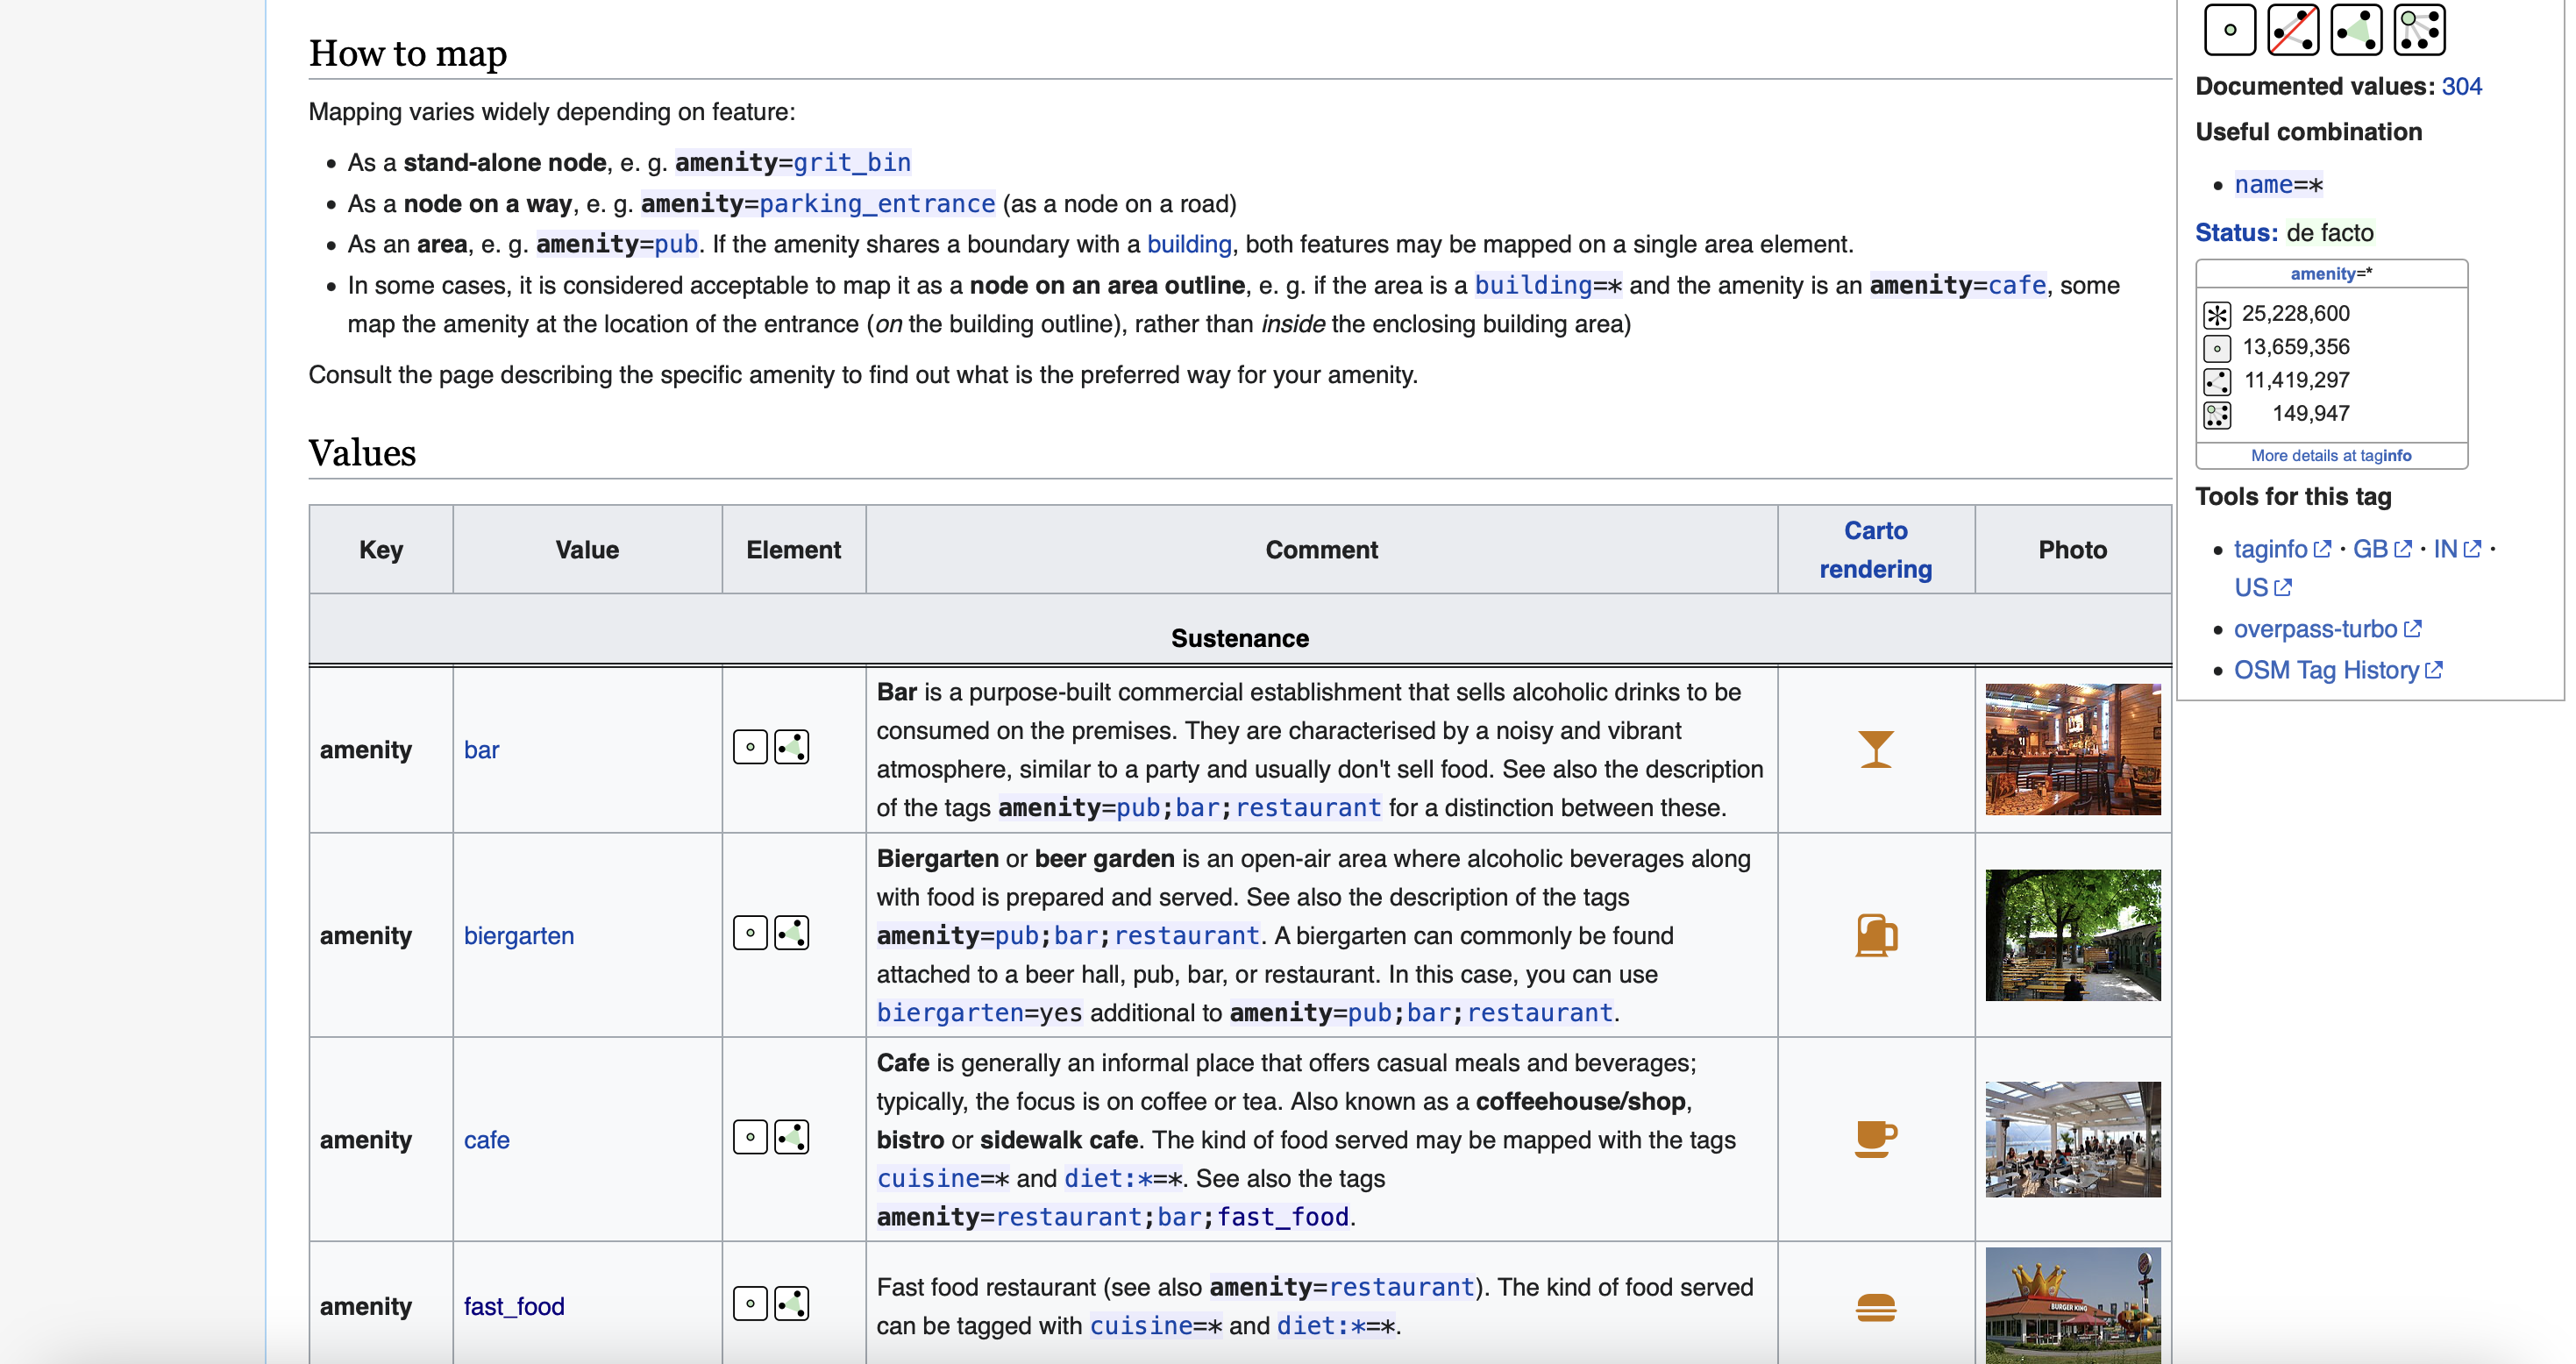
How do we know what to Search For?
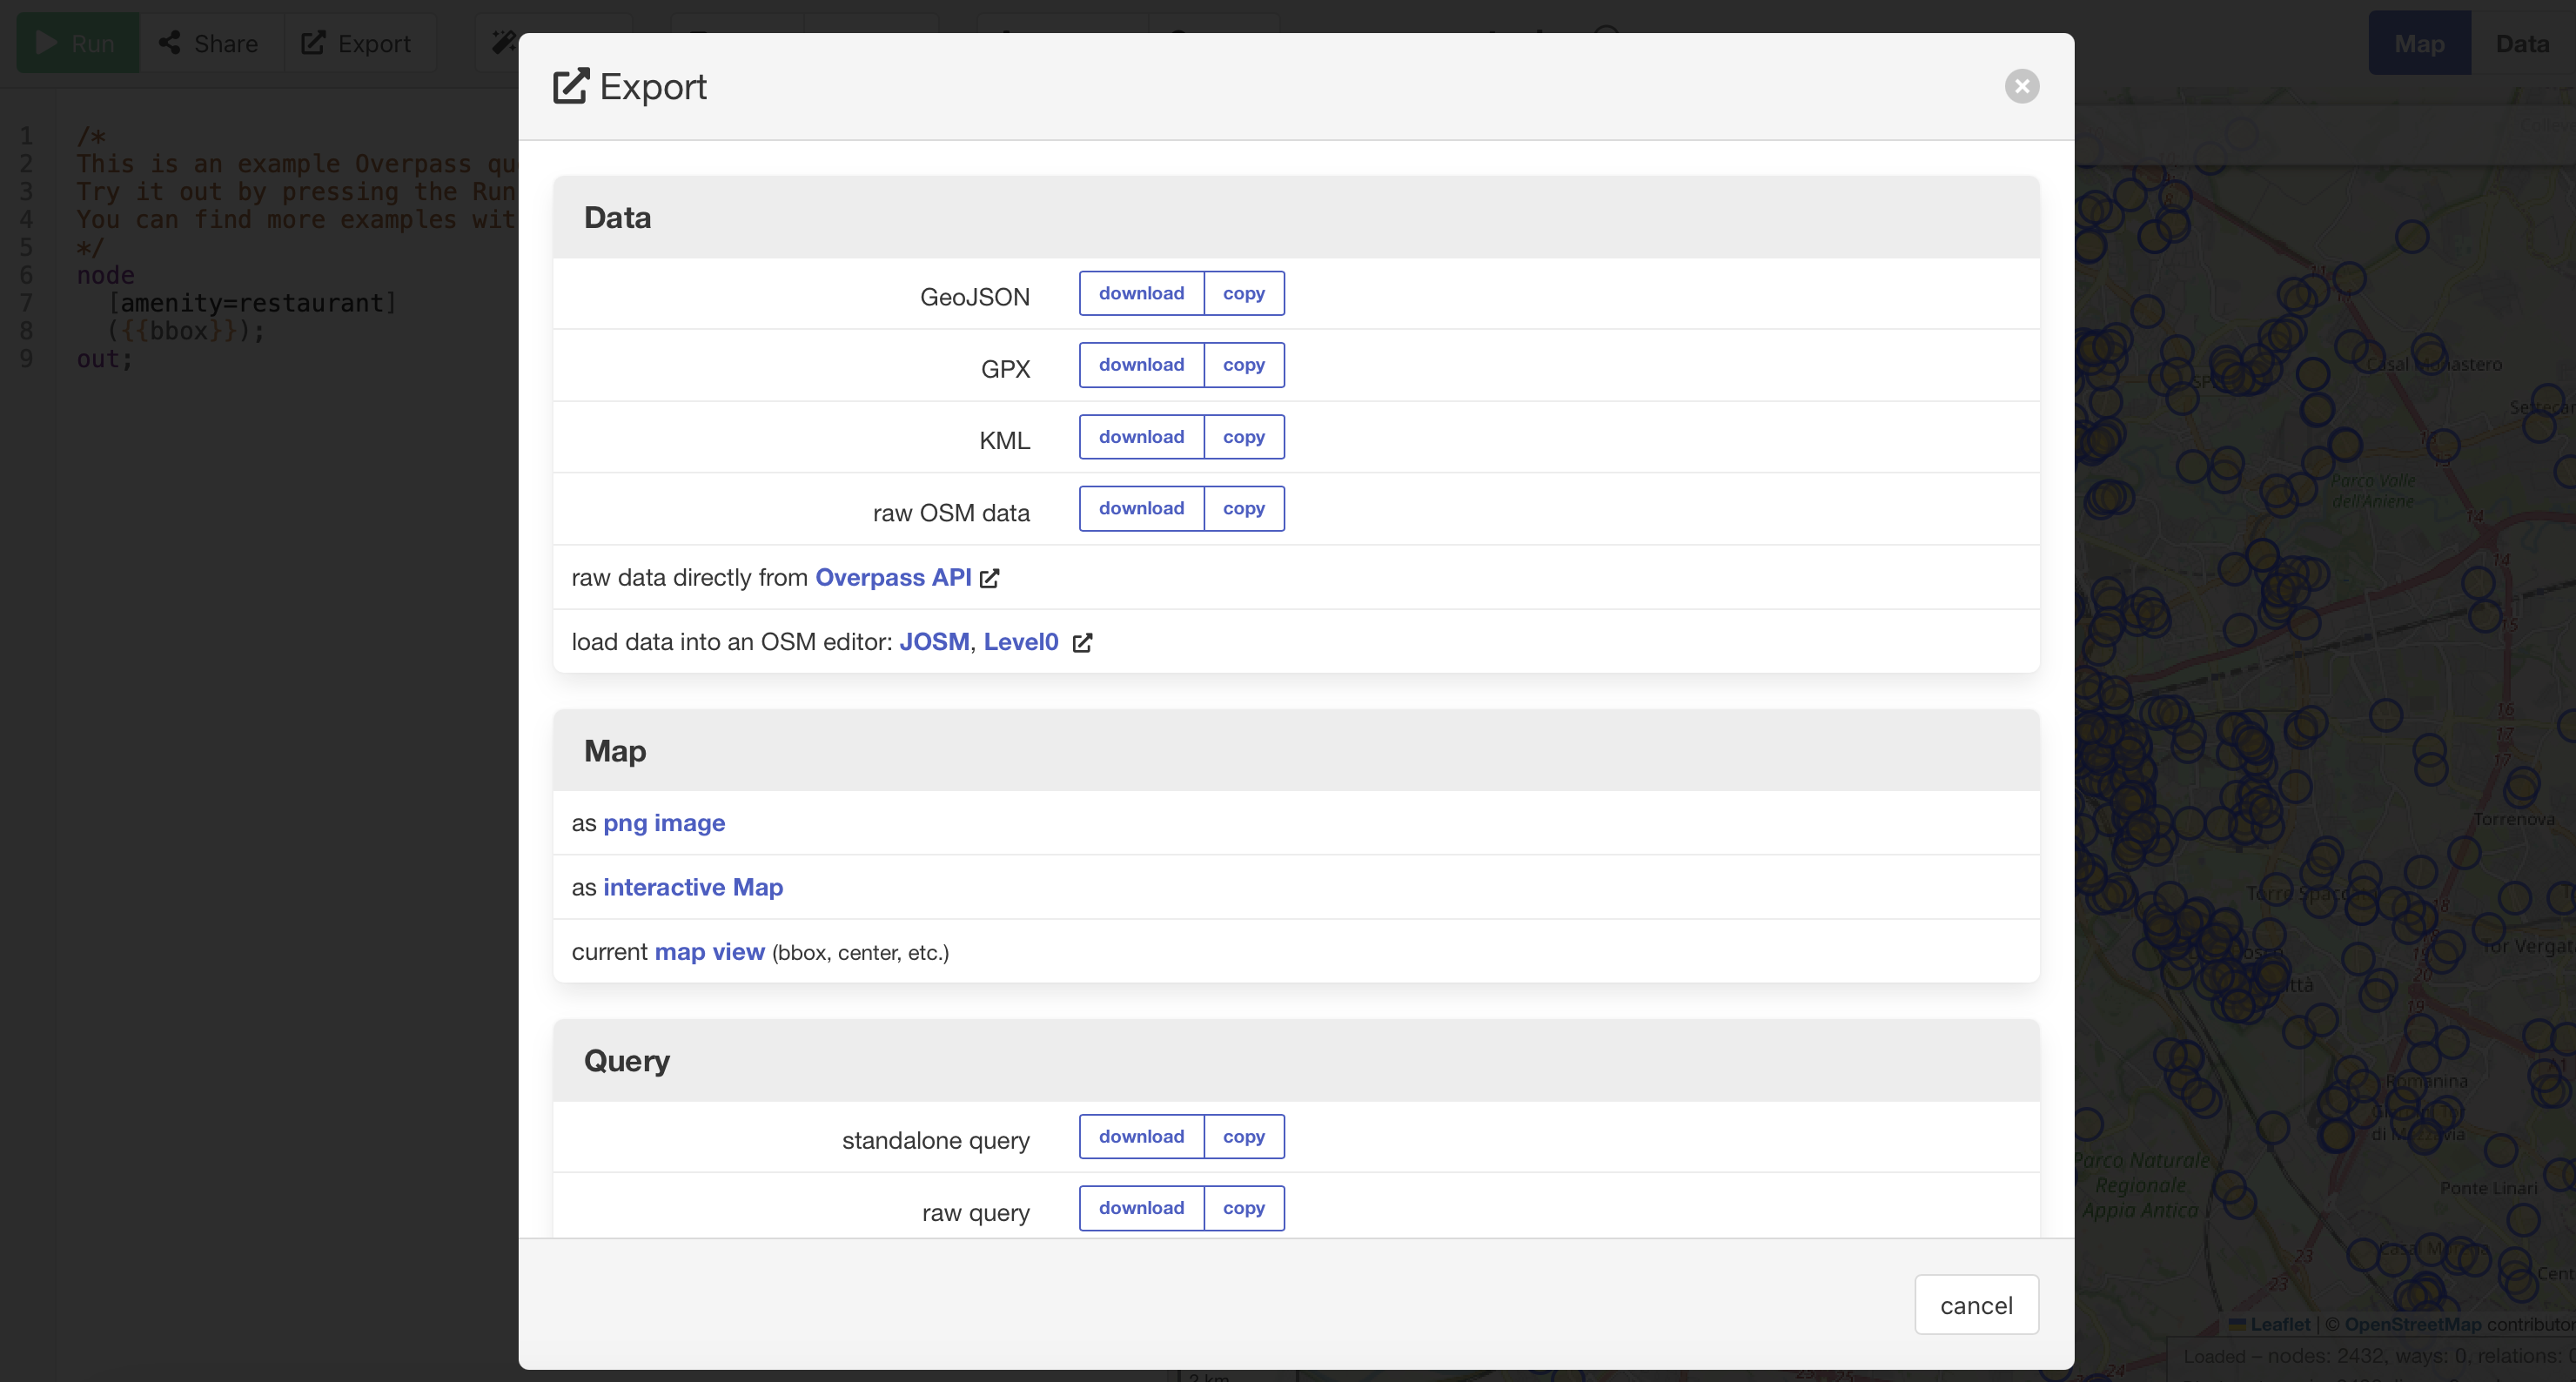
The Data: Restaurants
We then download the data in geojson format by clicking “Export” in the Overpass-Turbo page.
Geojson is a format for encoding a variety of geographic data structures.
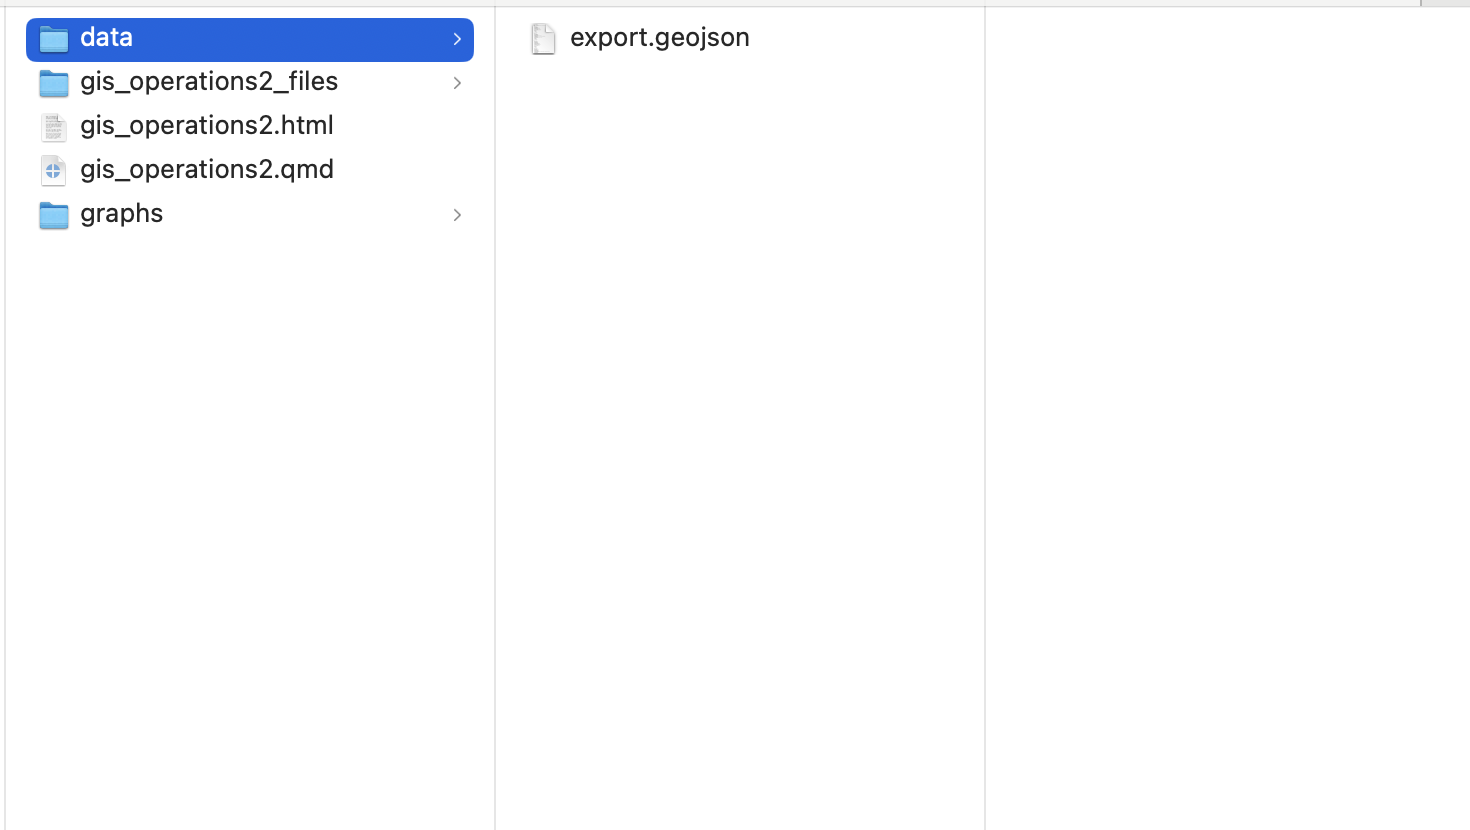
The Data: Restaurants
We then save the data in the relevant folder.
The Data: Restaurants
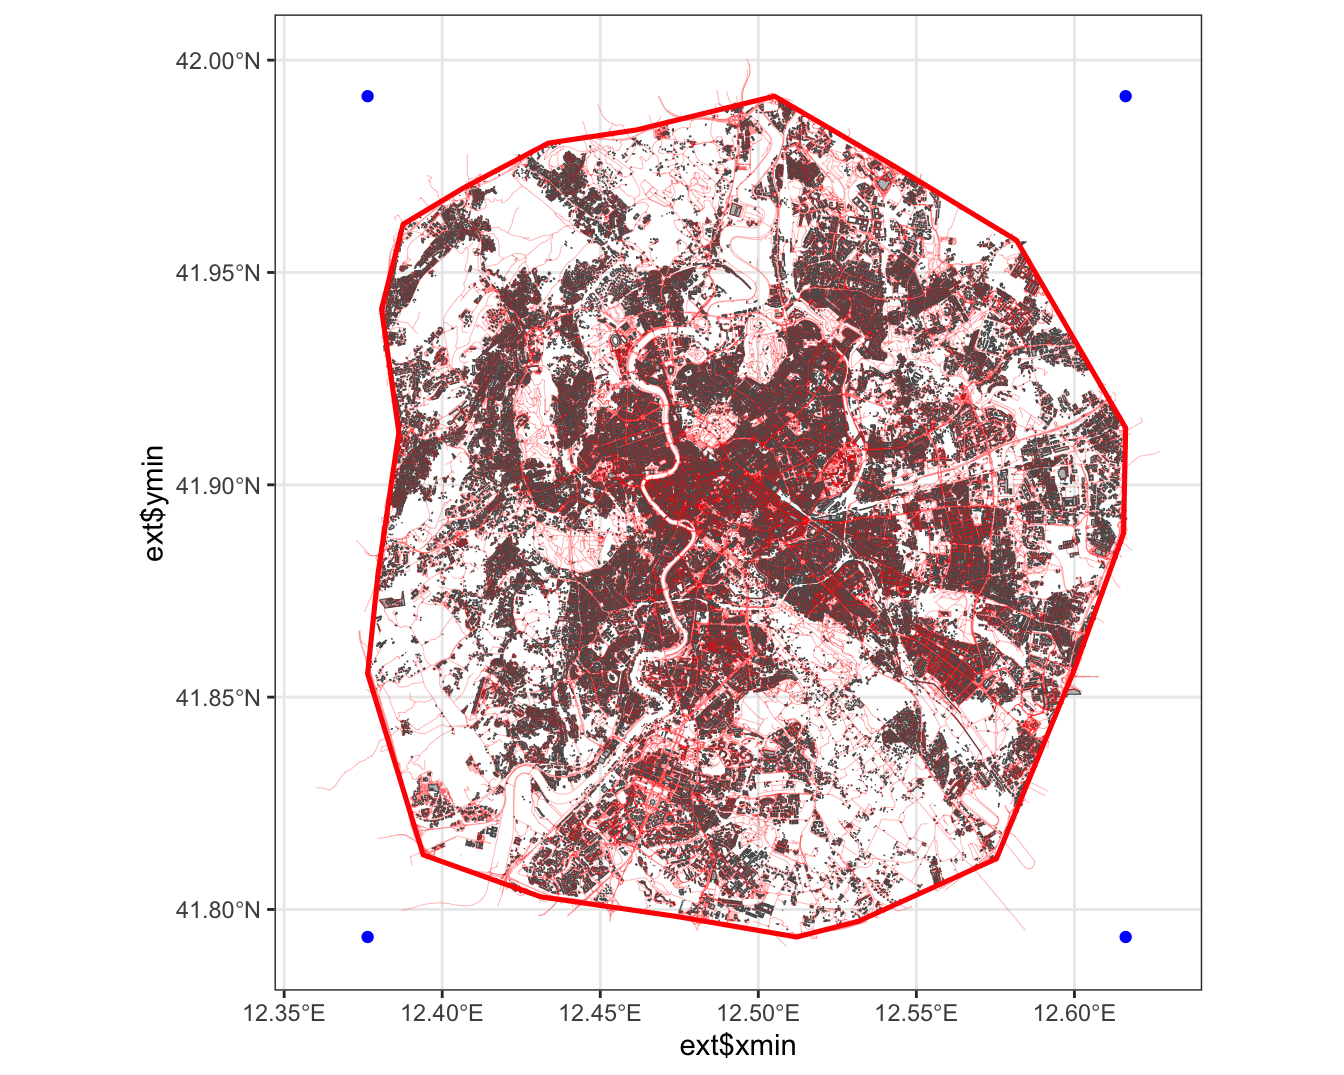
Show Code
fig<-ggplot()+
  geom_sf(data=relev_poly, linewidth = 0.1, fill = NA, color = "red", alpha=0.5)+
  geom_sf(data=restaurants, color="blue", size=0.2)+
    ggspatial::annotation_scale(location = 'tr')+
    geom_sf(data=gis_osm_roads, linewidth = 0.1, color = "black", alpha=0.5)+
    theme(panel.grid.major = element_blank(), panel.grid.minor = element_blank())+
      coord_sf(xlim = c(min_lon_x - error, max_lon_x + error),
           ylim = c(min_lat_y - error, max_lat_y + error))
fig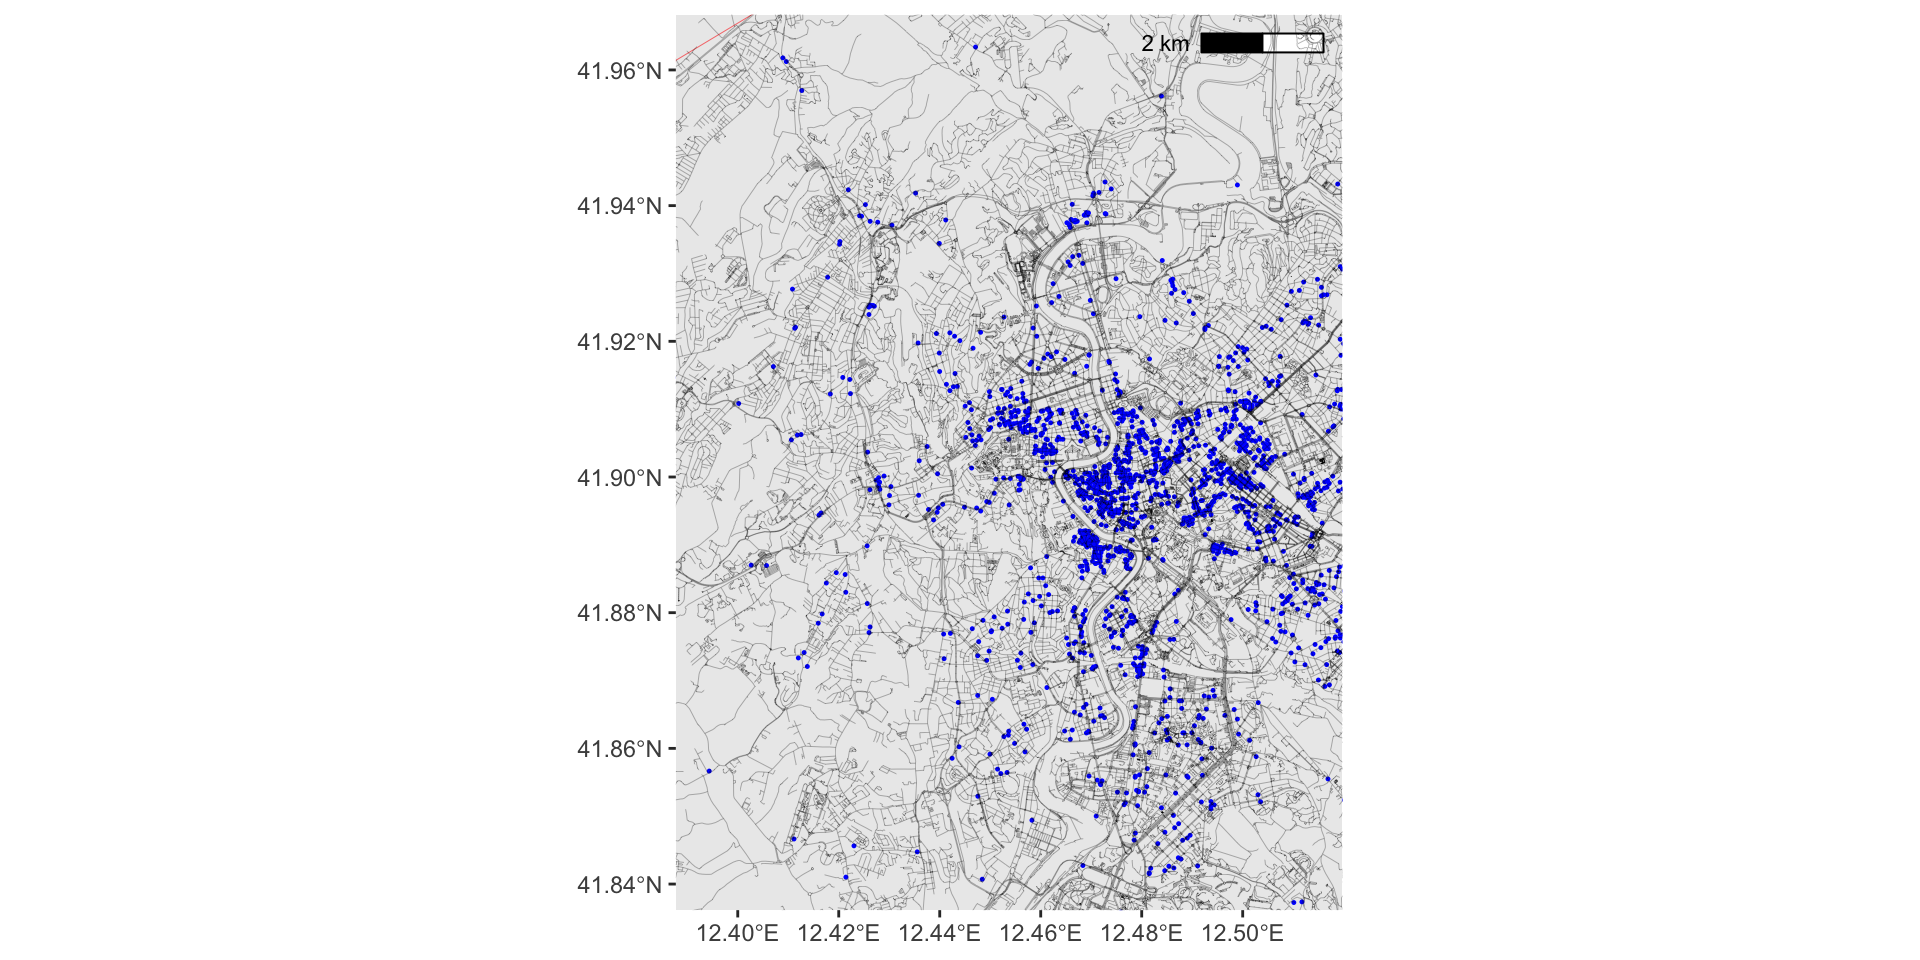
The Data: Fast-food restaurants
We can also search for fast-food restaurants.
The Data: Fast-food restaurants
We can also search for fast-food restaurants.
The Data: Fast-food restaurants
We can also search for fast-food restaurants.
The Data: Fast-food restaurants
This what this data looks like using ggplot:
Show Code
#Step1: Reading geojson
fastfood <- read_sf("./data/fast_food.geojson", quiet=TRUE)
fig<-ggplot()+
  geom_sf(data=relev_poly, linewidth = 0.1, fill = NA, color = "red", alpha=0.5)+
    ggspatial::annotation_scale(location = 'tr')+
    geom_sf(data=gis_osm_roads, linewidth = 0.1, color = "black", alpha=0.5)+
    geom_sf(data=fastfood, color="red", size=0.2)+
    theme(panel.grid.major = element_blank(), panel.grid.minor = element_blank())+
      coord_sf(xlim = c(min_lon_x - error, max_lon_x + error),
           ylim = c(min_lat_y - error, max_lat_y + error))
fig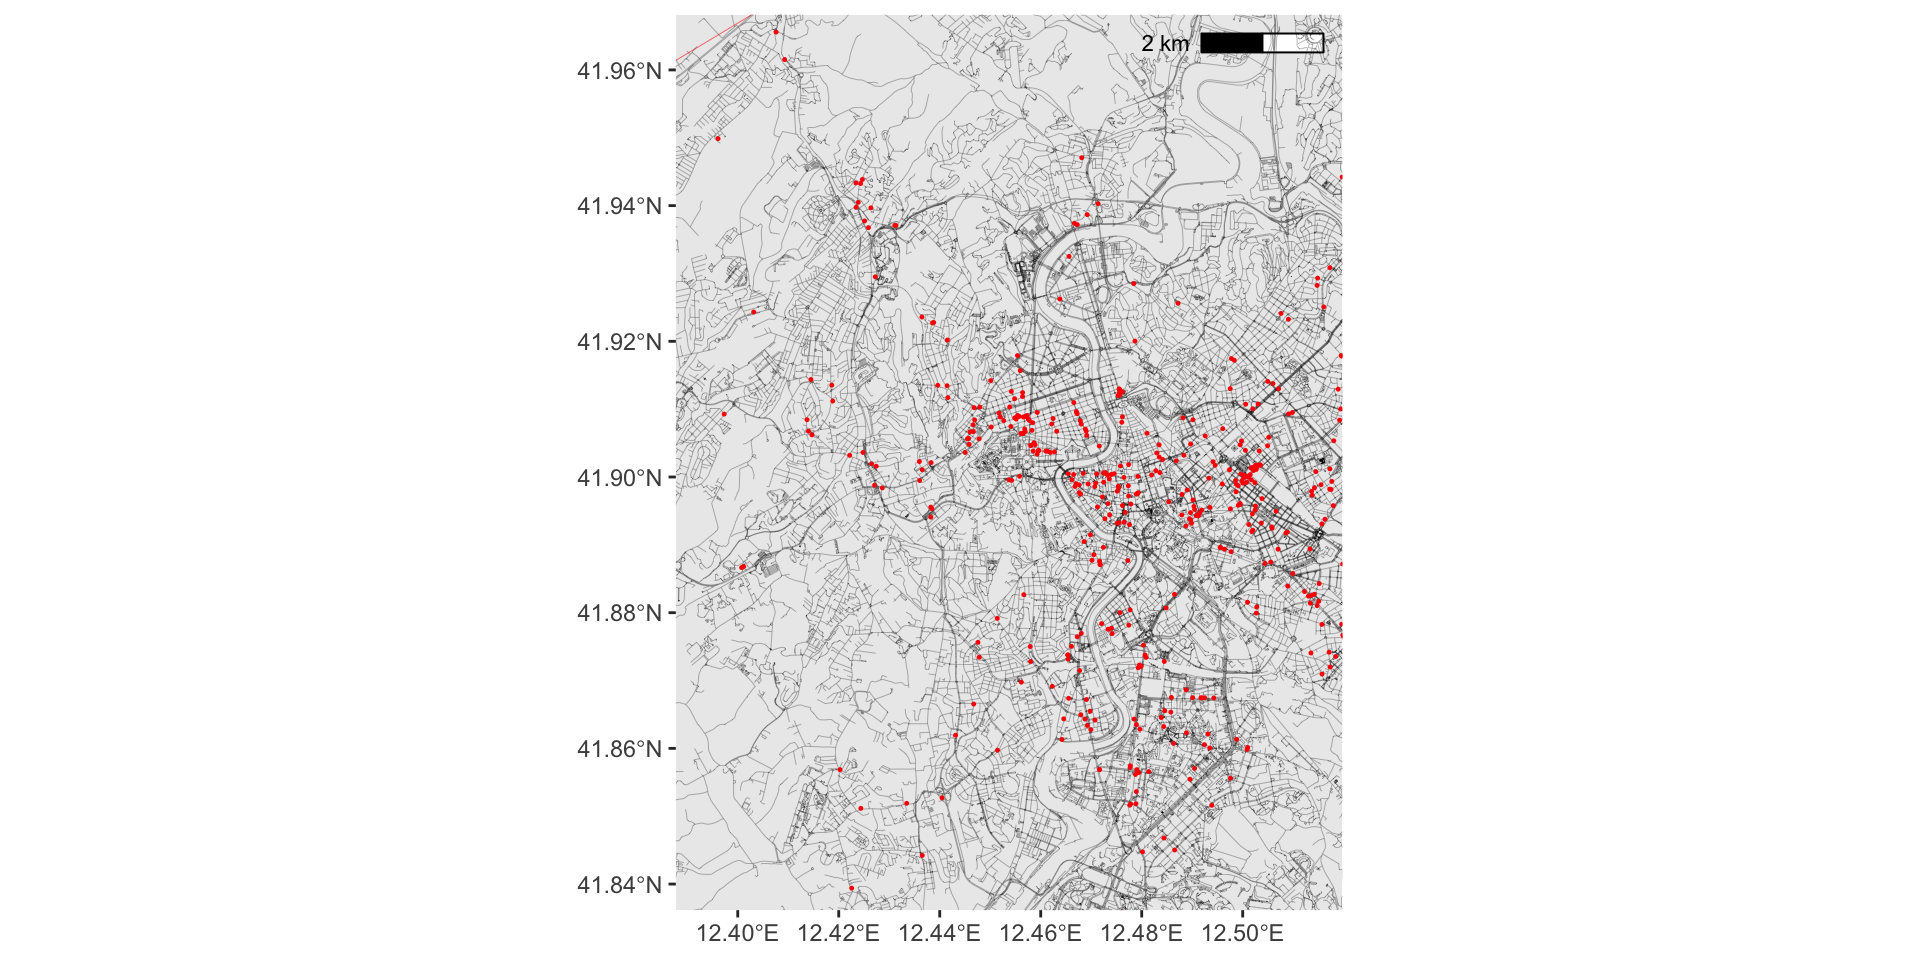
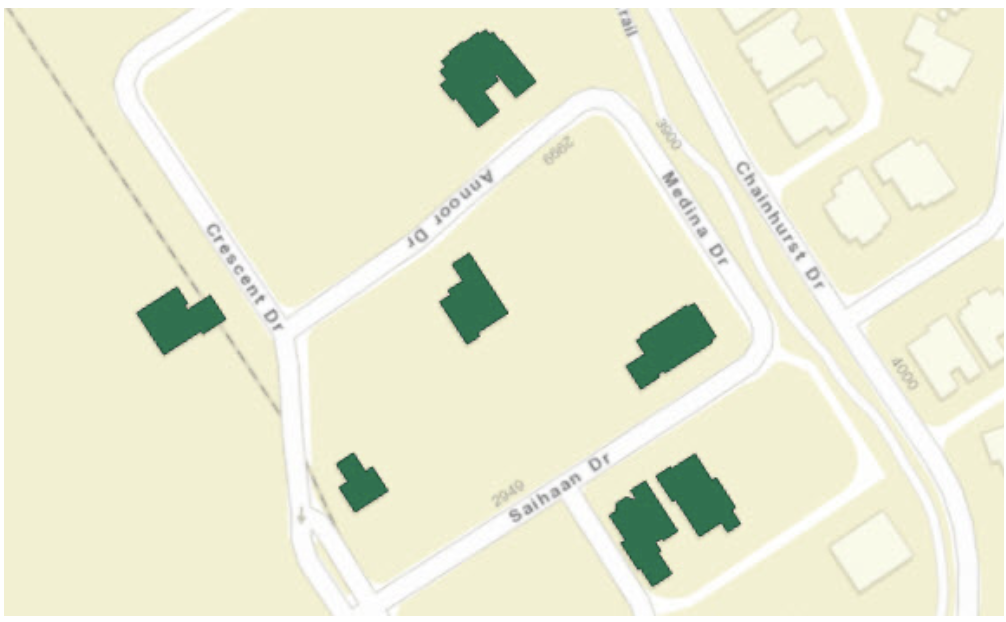
The Data: McDonald’s
This is the original data:
Show Code
fig<-ggplot()+
  geom_sf(data=relev_poly, linewidth = 0.1, fill = NA, color = "red", alpha=0.5)+
    ggspatial::annotation_scale(location = 'tr')+
    geom_sf(data=gis_osm_roads, linewidth = 0.1, color = "black", alpha=0.1)+
    geom_sf(data=fastfood, color="red", size=0.2)+
    theme(panel.grid.major = element_blank(), panel.grid.minor = element_blank())+
      coord_sf(xlim = c(min_lon_x - error, max_lon_x + error),
           ylim = c(min_lat_y - error, max_lat_y + error))
fig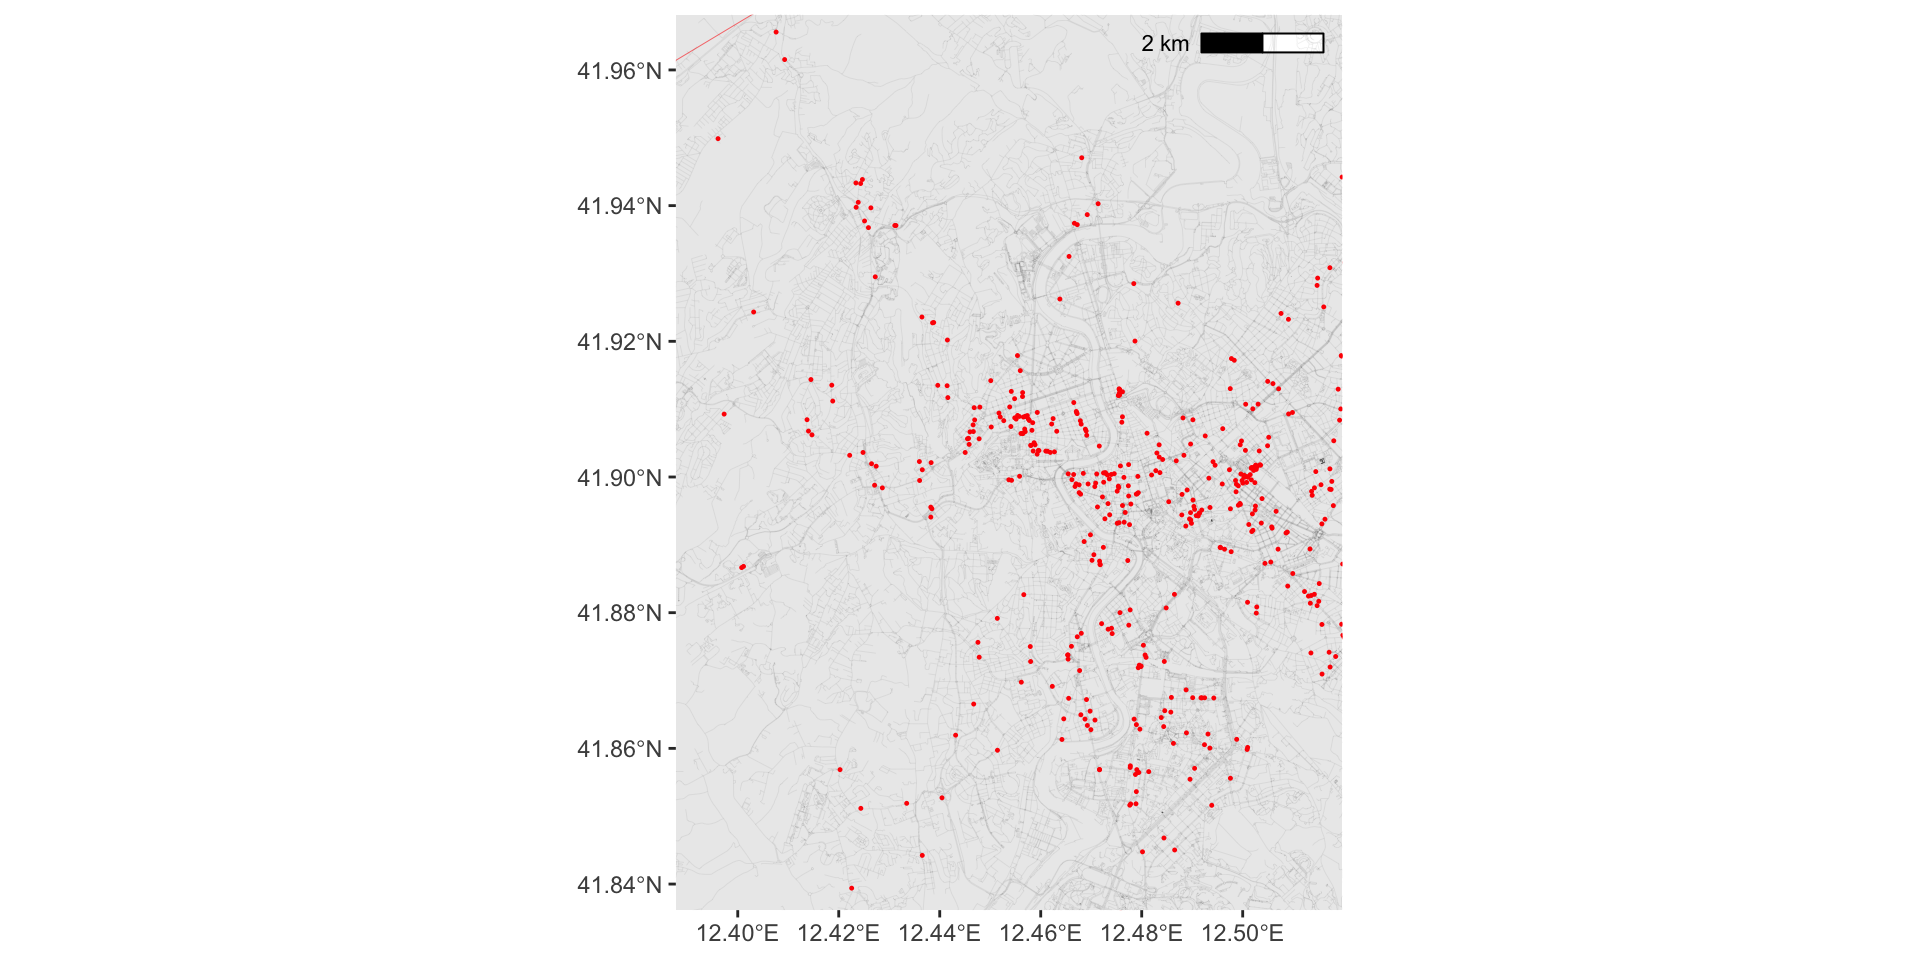
The Data: McDonald’s
This is only McDonald’s:
Show Code
fig<-ggplot()+
  geom_sf(data=relev_poly, linewidth = 0.1, fill = NA, color = "red", alpha=0.5)+
    ggspatial::annotation_scale(location = 'tr')+
    geom_sf(data=gis_osm_roads, linewidth = 0.1, color = "black", alpha=0.1)+
    geom_sf(data=mcdon, color="yellow", size=0.5)+
    theme(panel.grid.major = element_blank(), panel.grid.minor = element_blank())+
      coord_sf(xlim = c(min_lon_x - error, max_lon_x + error),
           ylim = c(min_lat_y - error, max_lat_y + error))
fig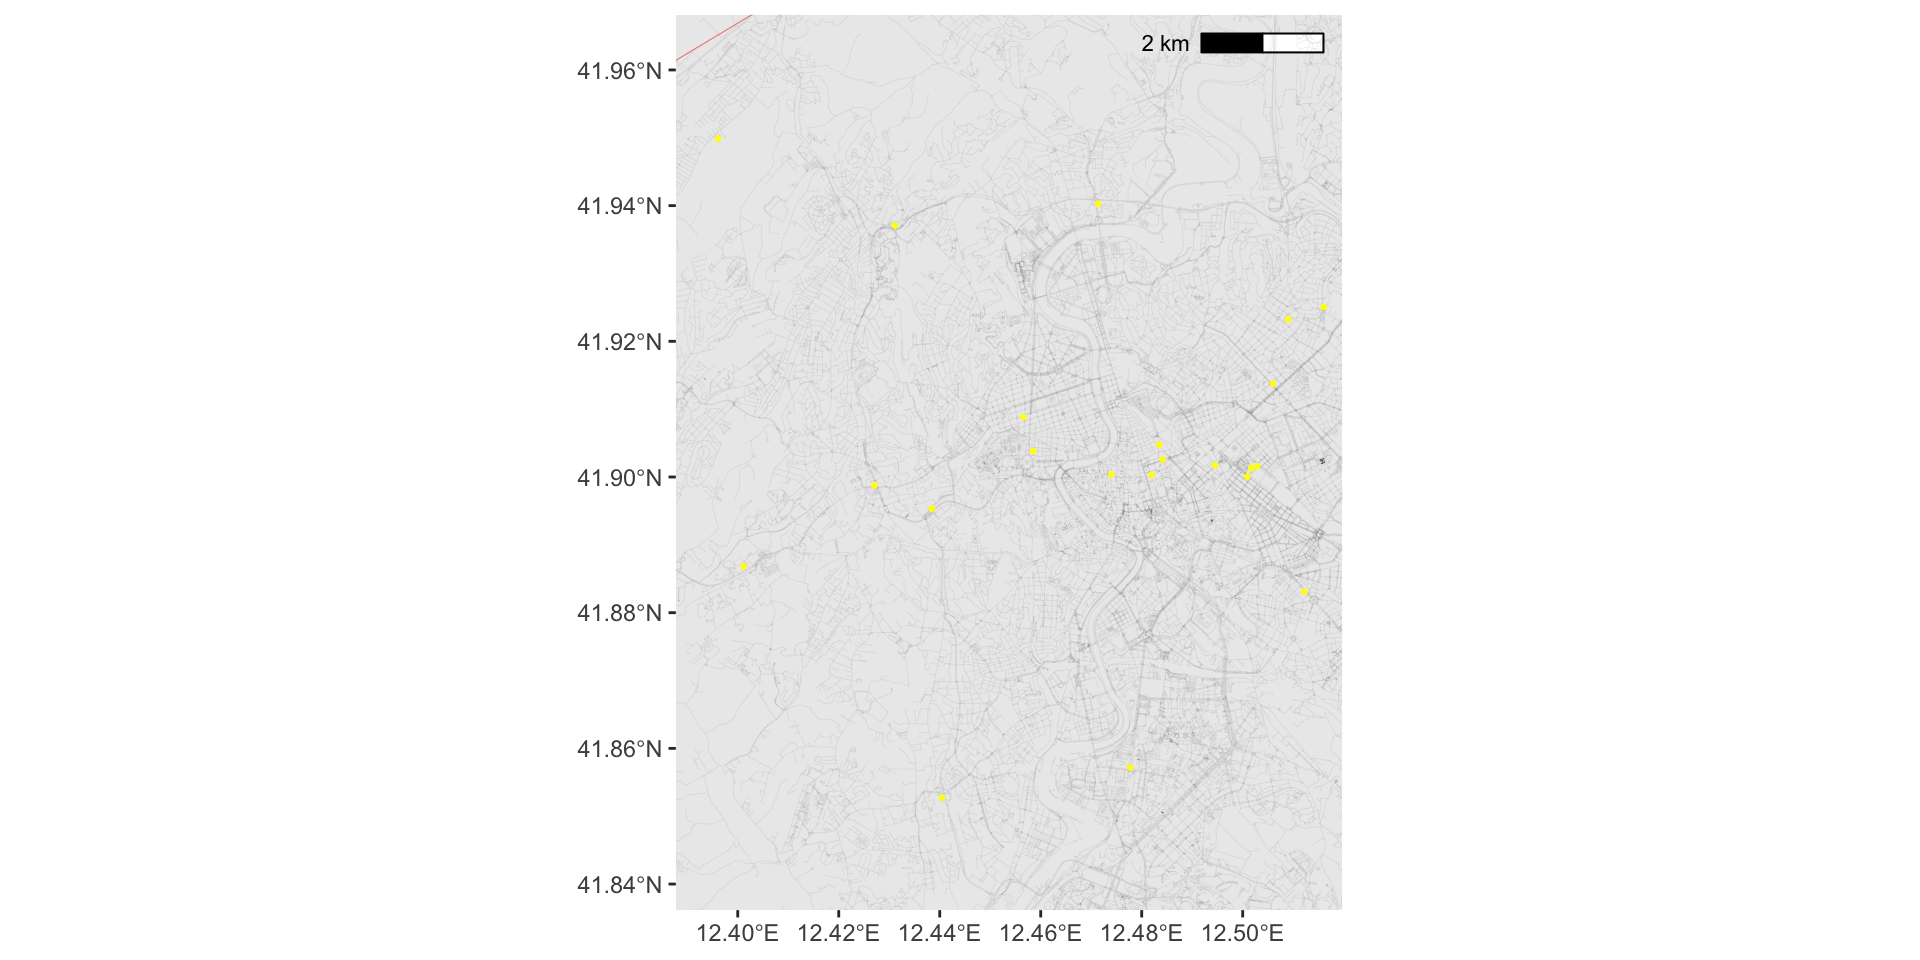
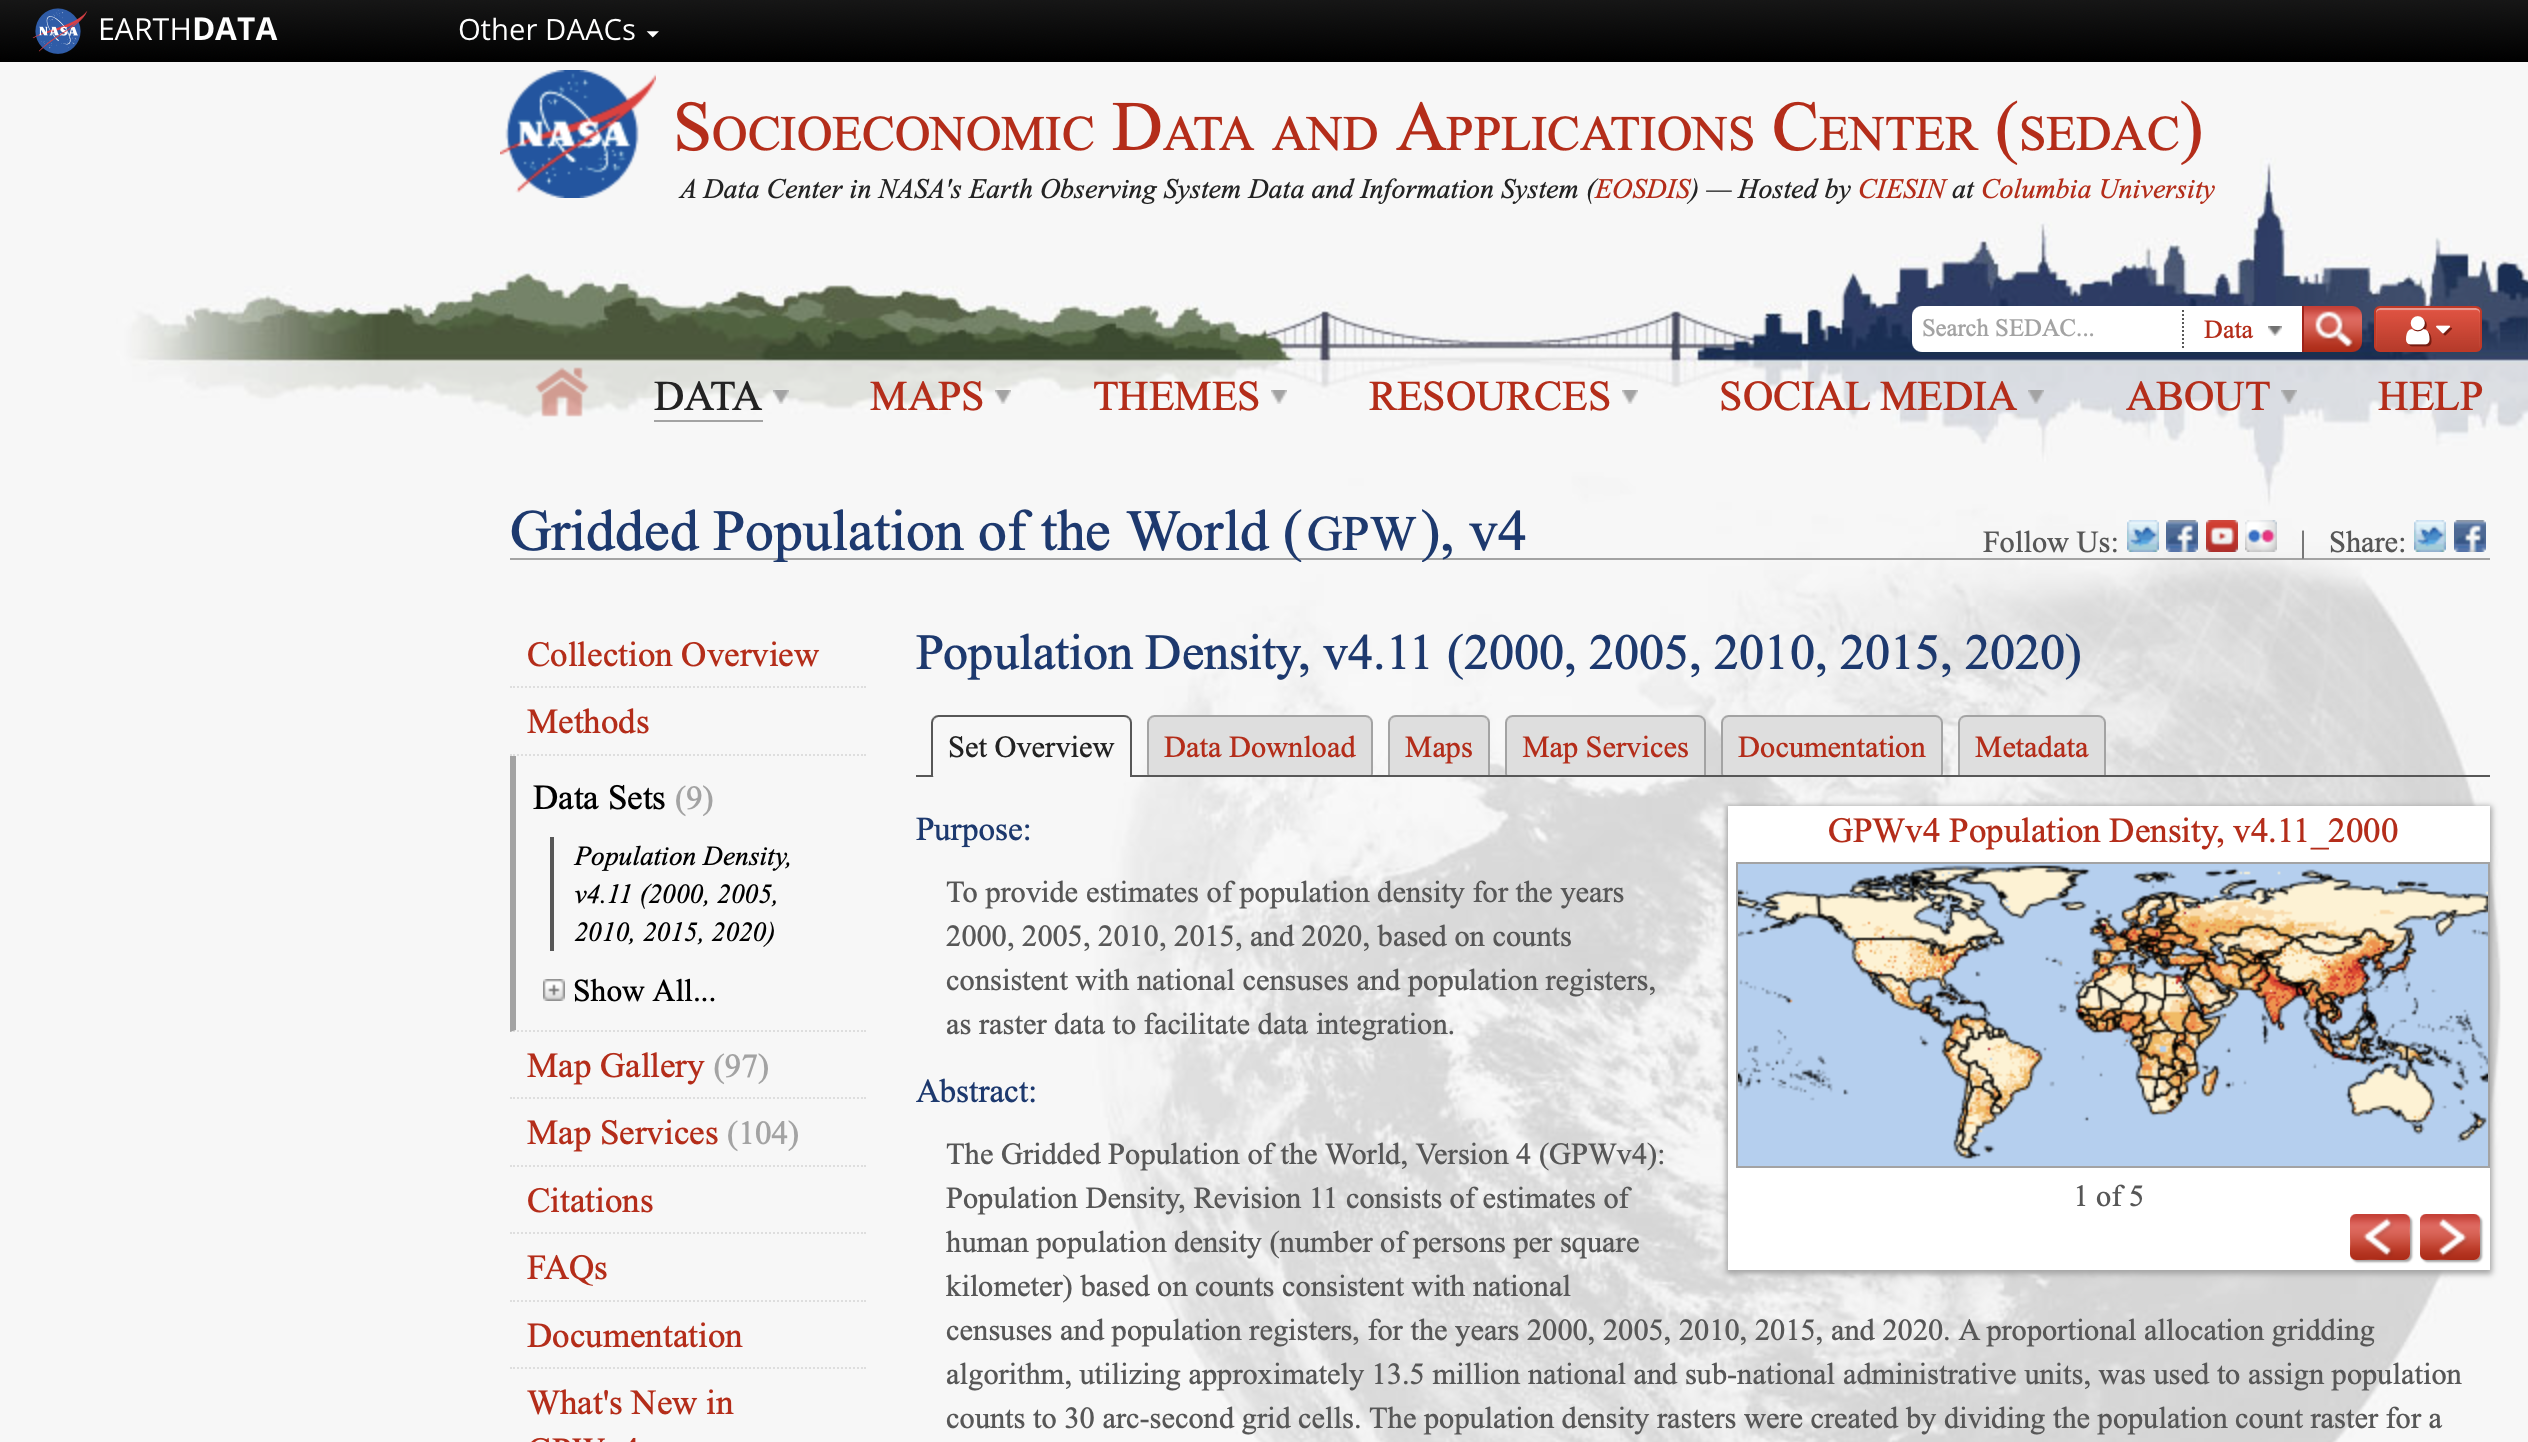
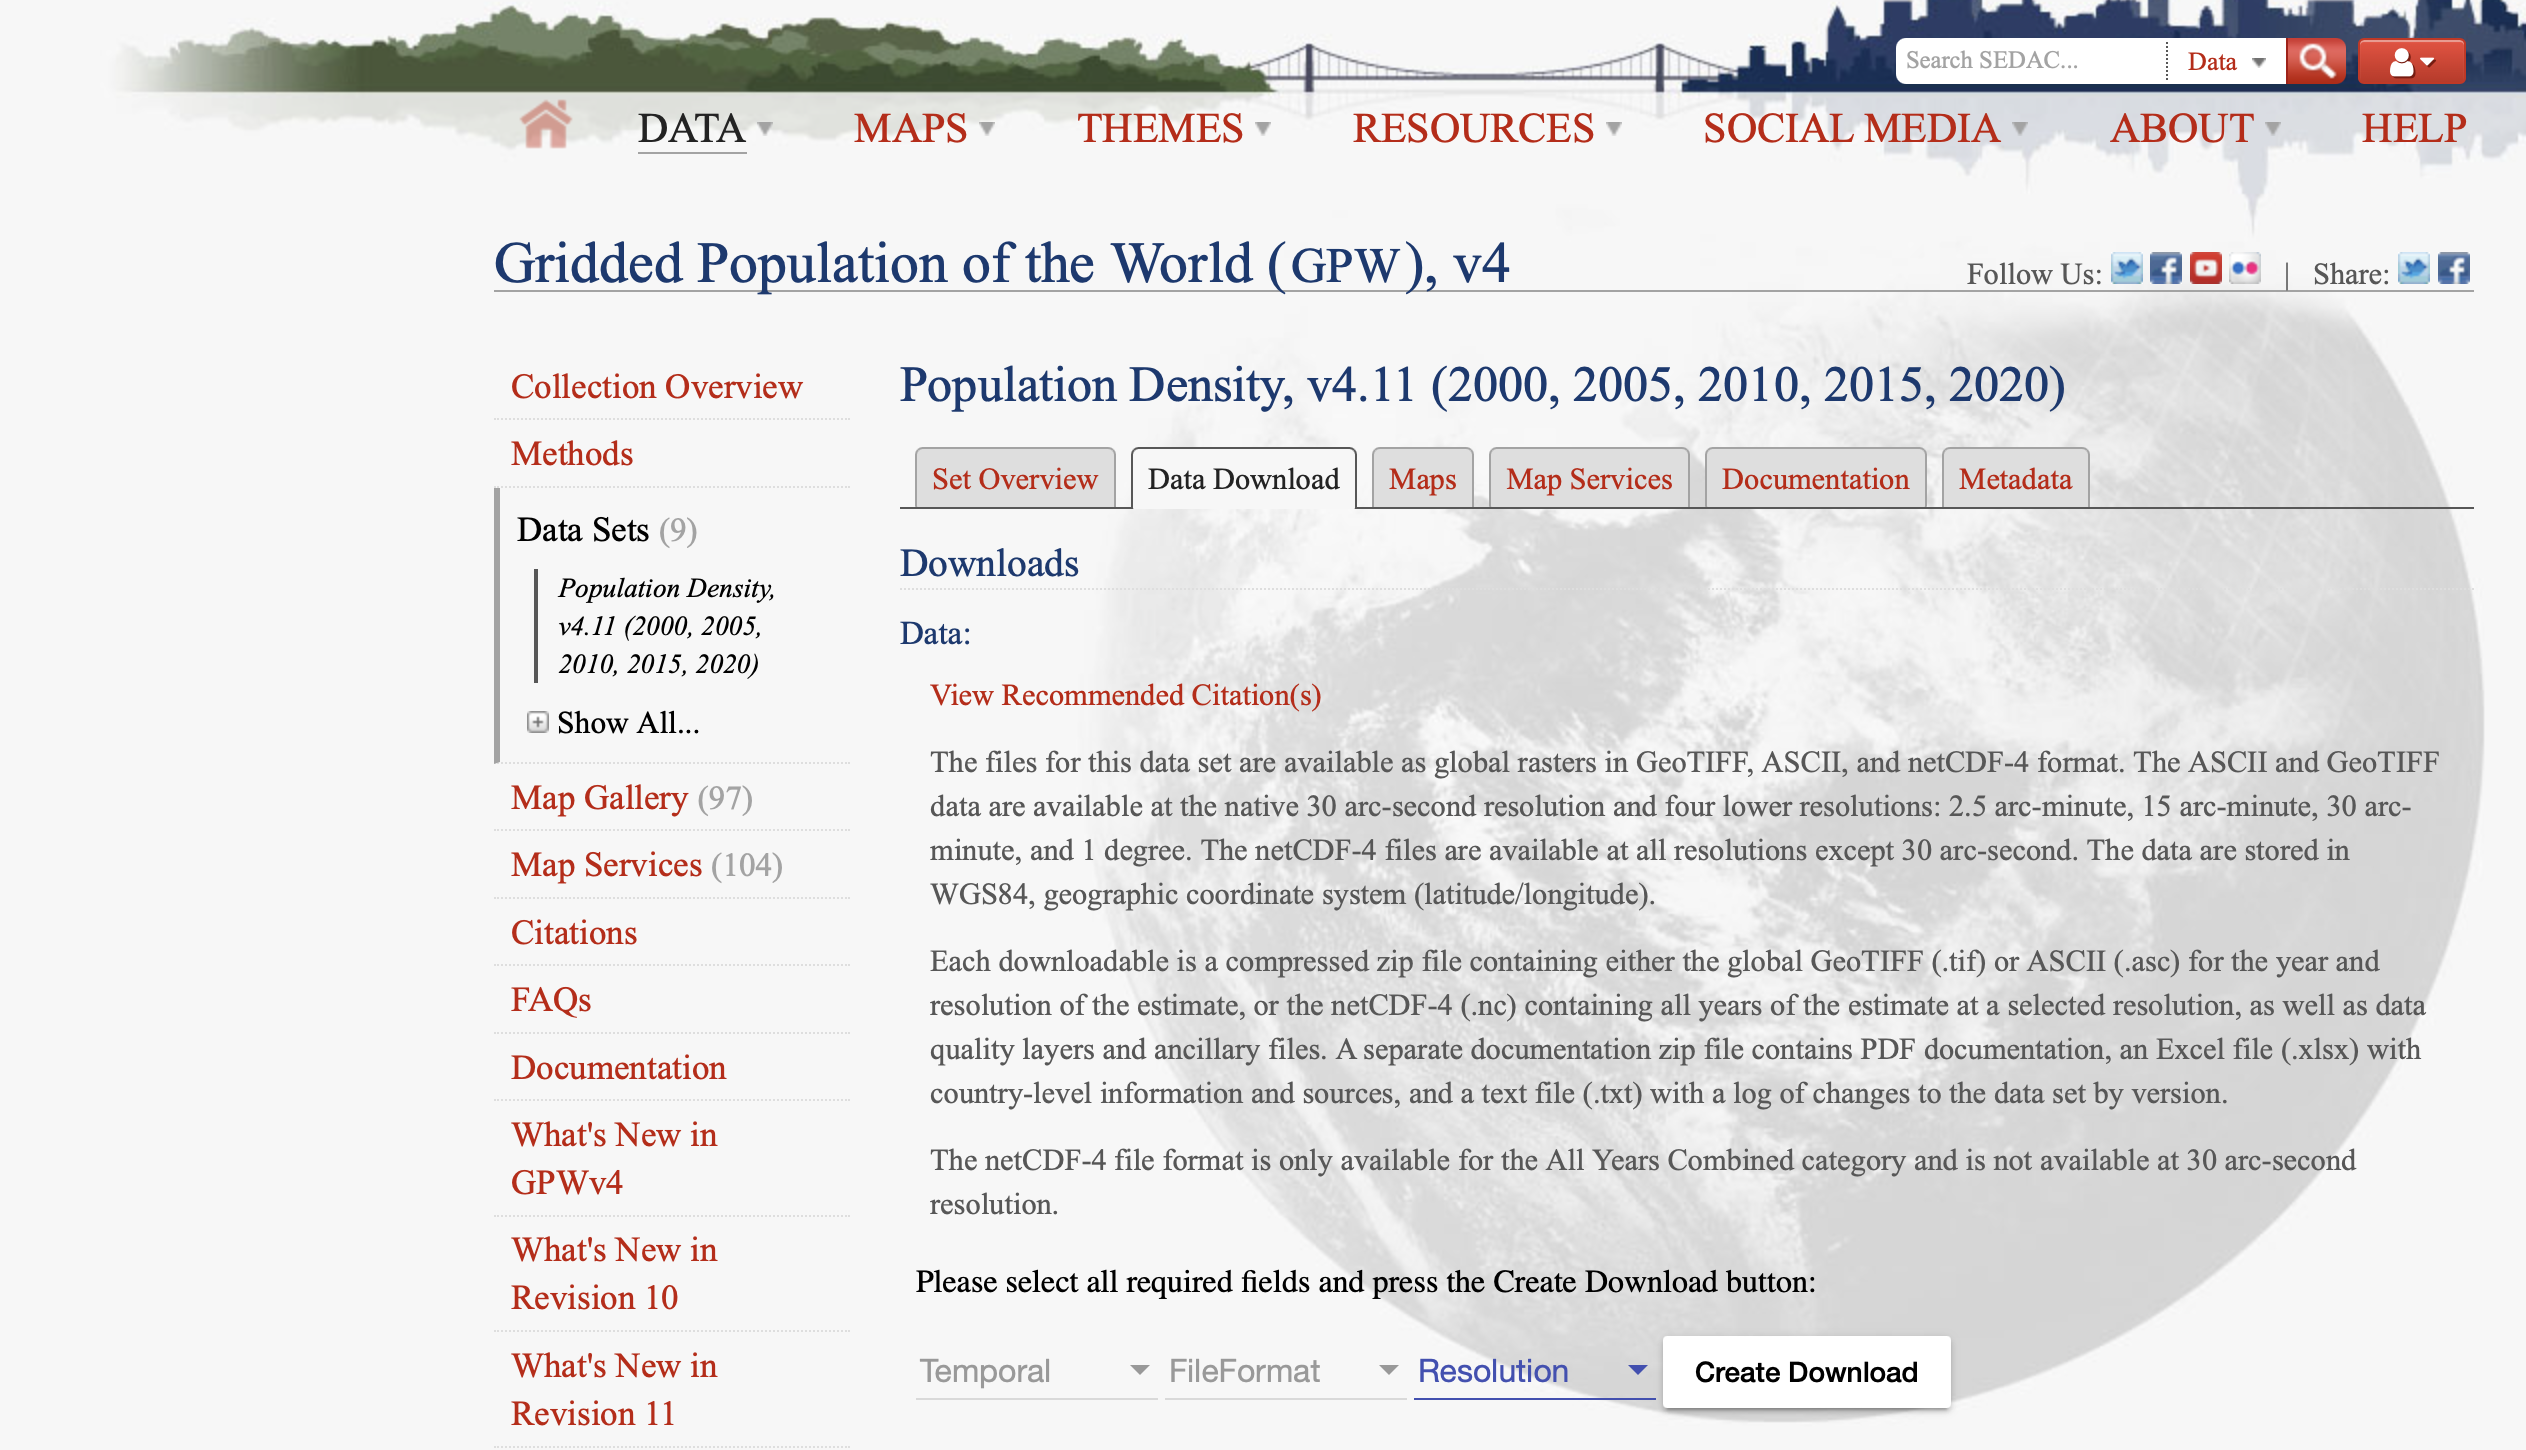
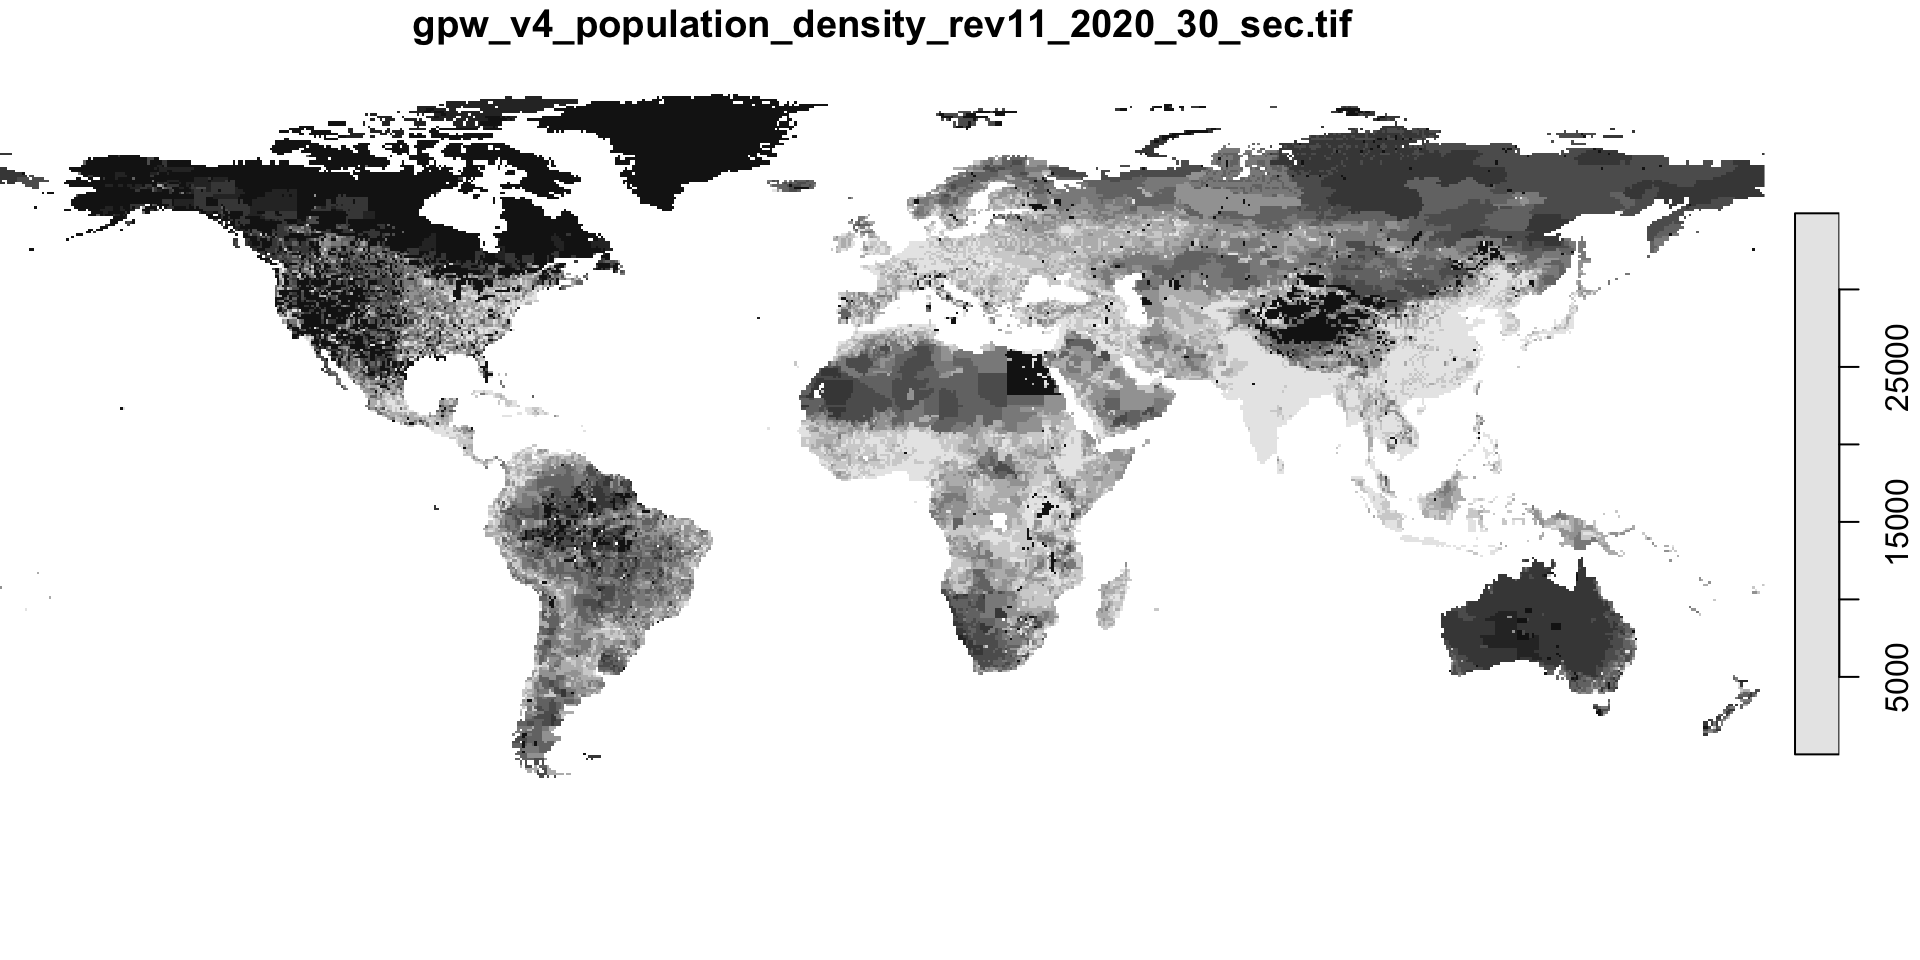
The Data: Population Raster
We can download population density from SEDAC.
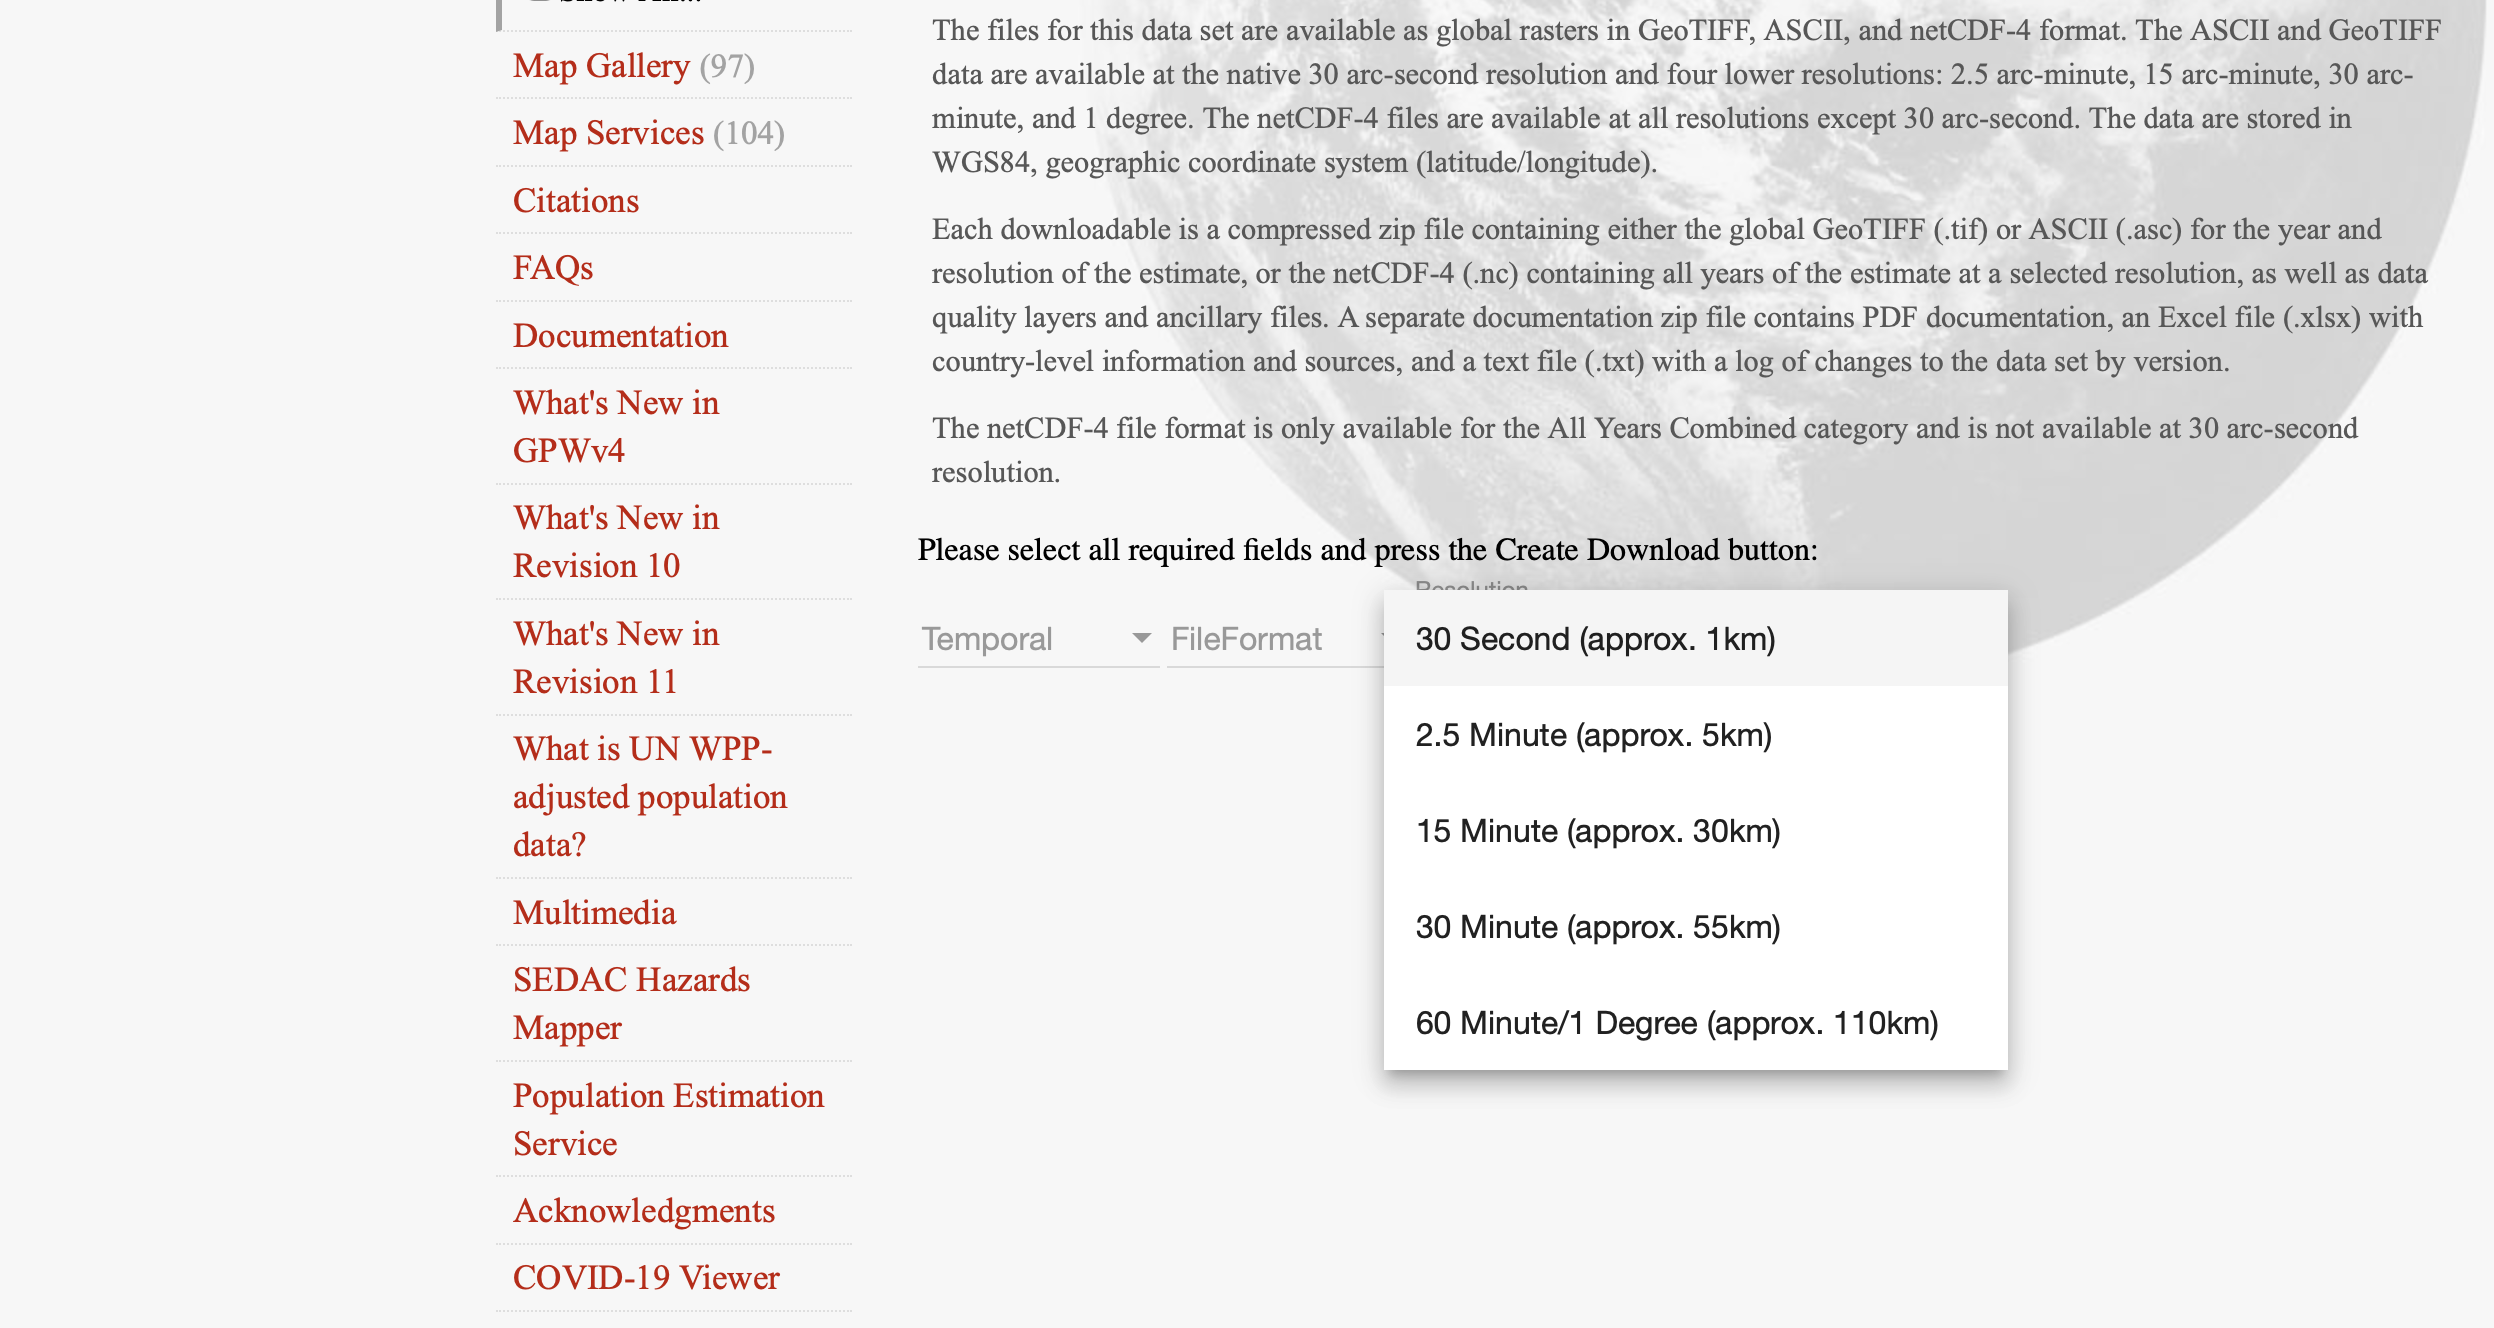
The Data: Population Raster
We can download population density from SEDAC.
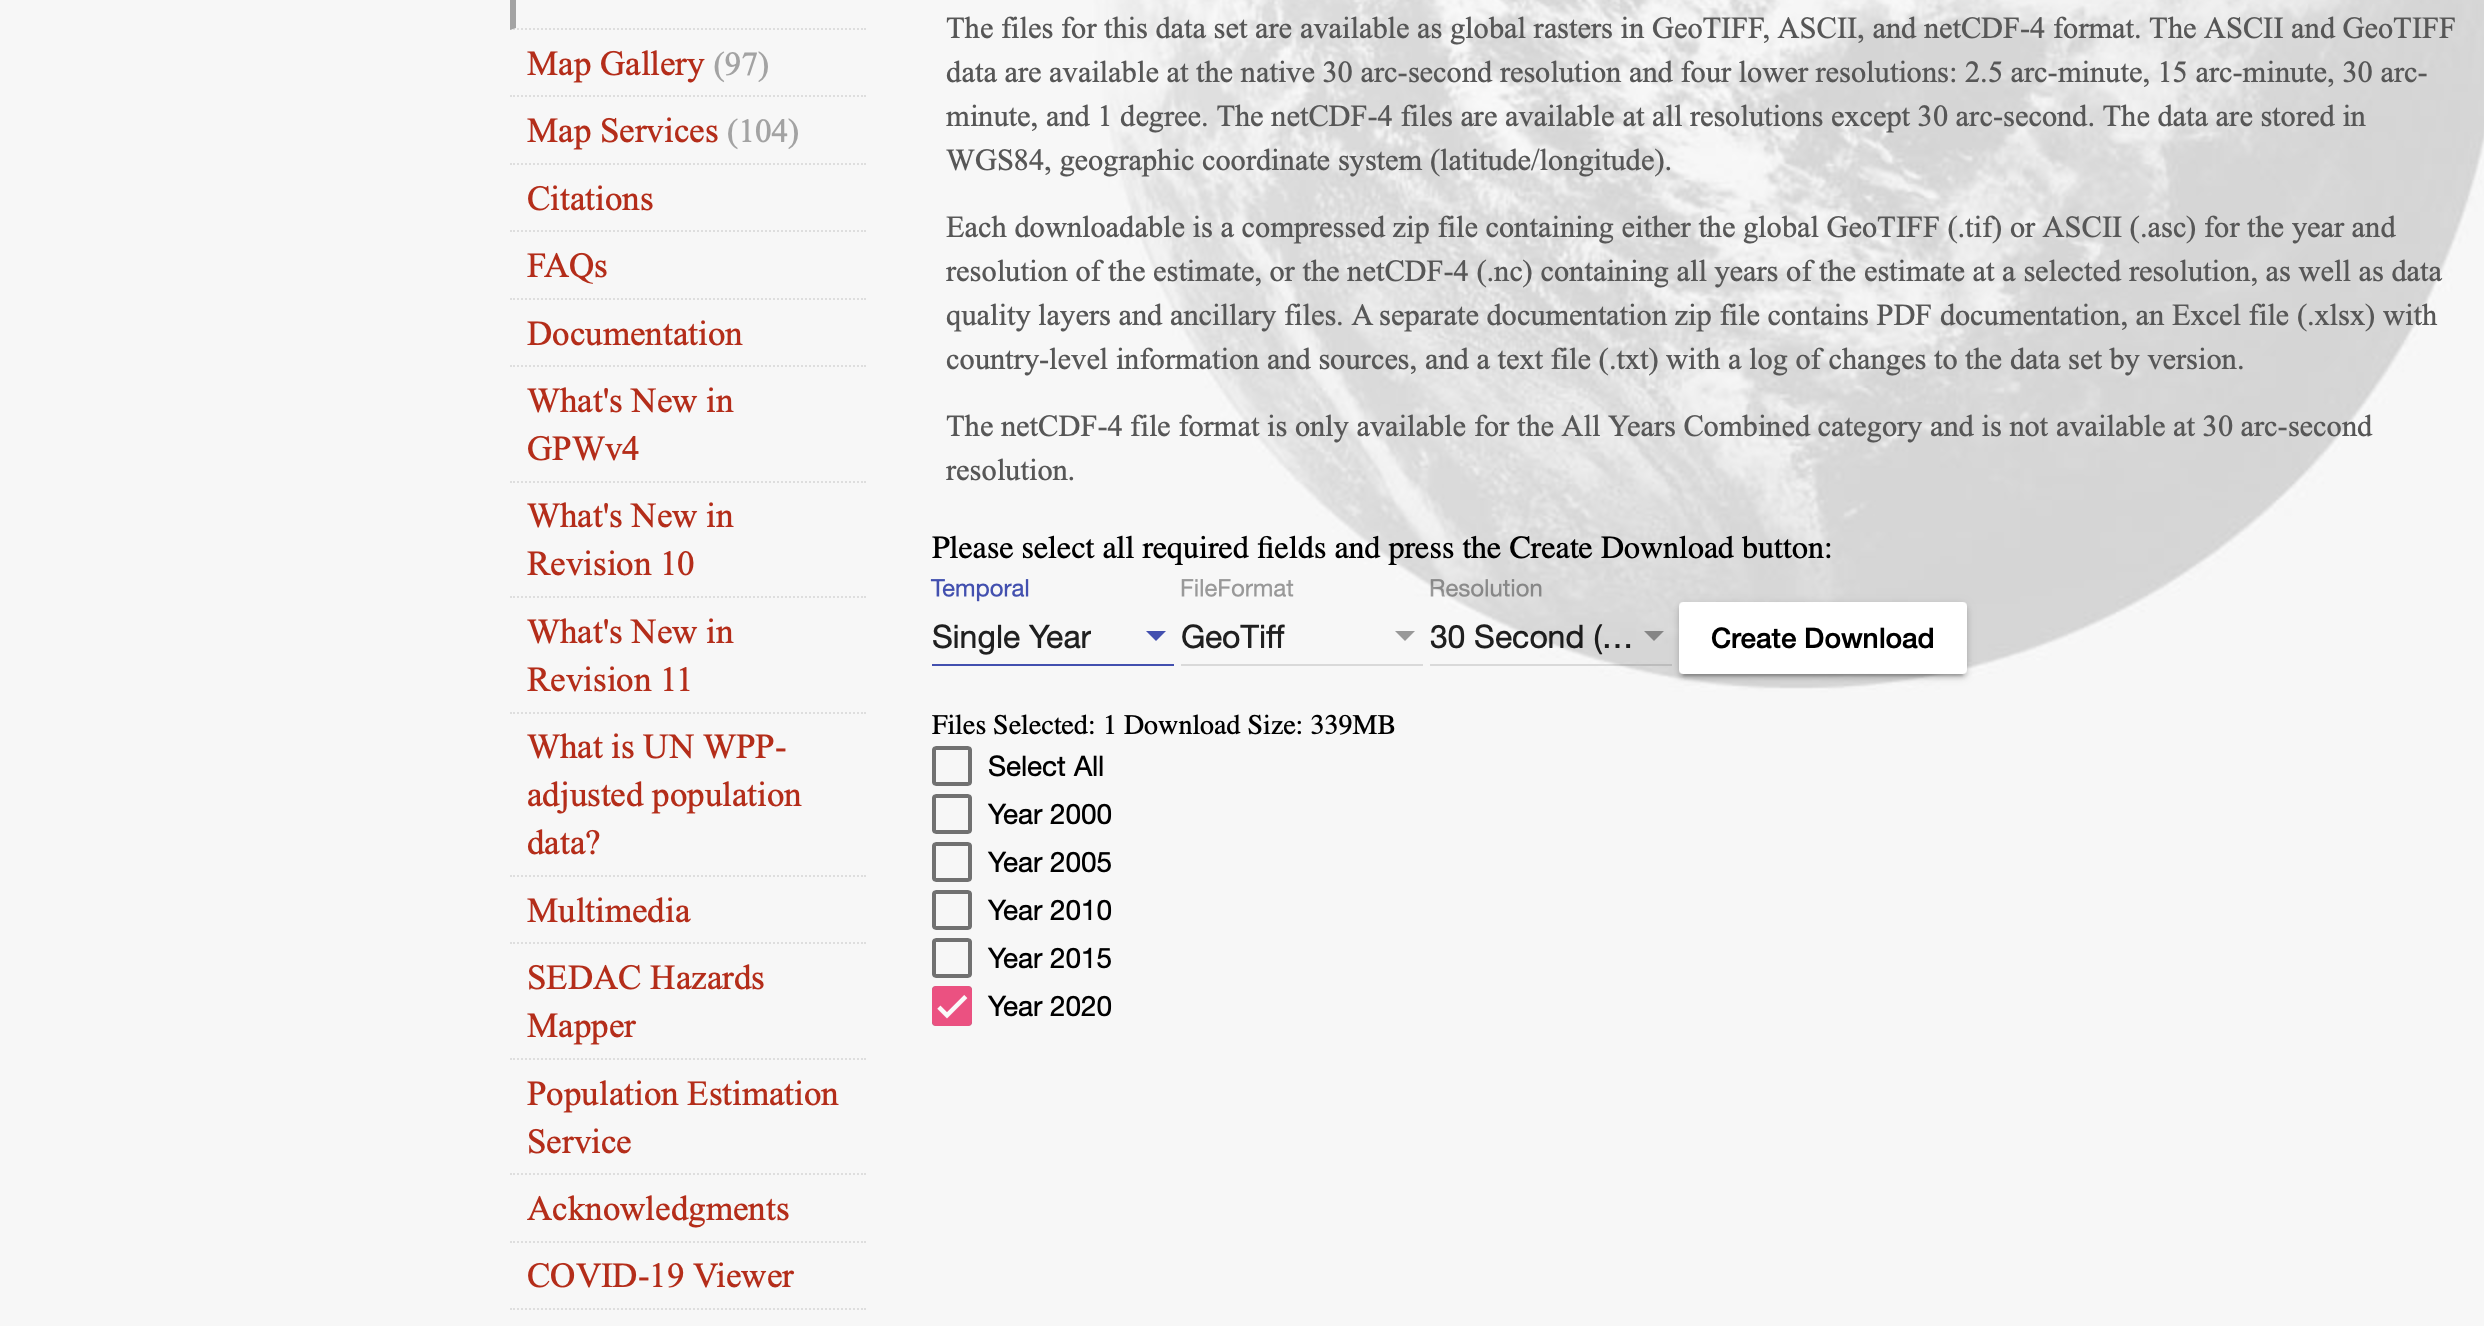
The Data: Population Raster
We can download population density from SEDAC.

The Data: Population Raster
We can download population density from SEDAC.
The Data: Population Raster
We can download population density from SEDAC.

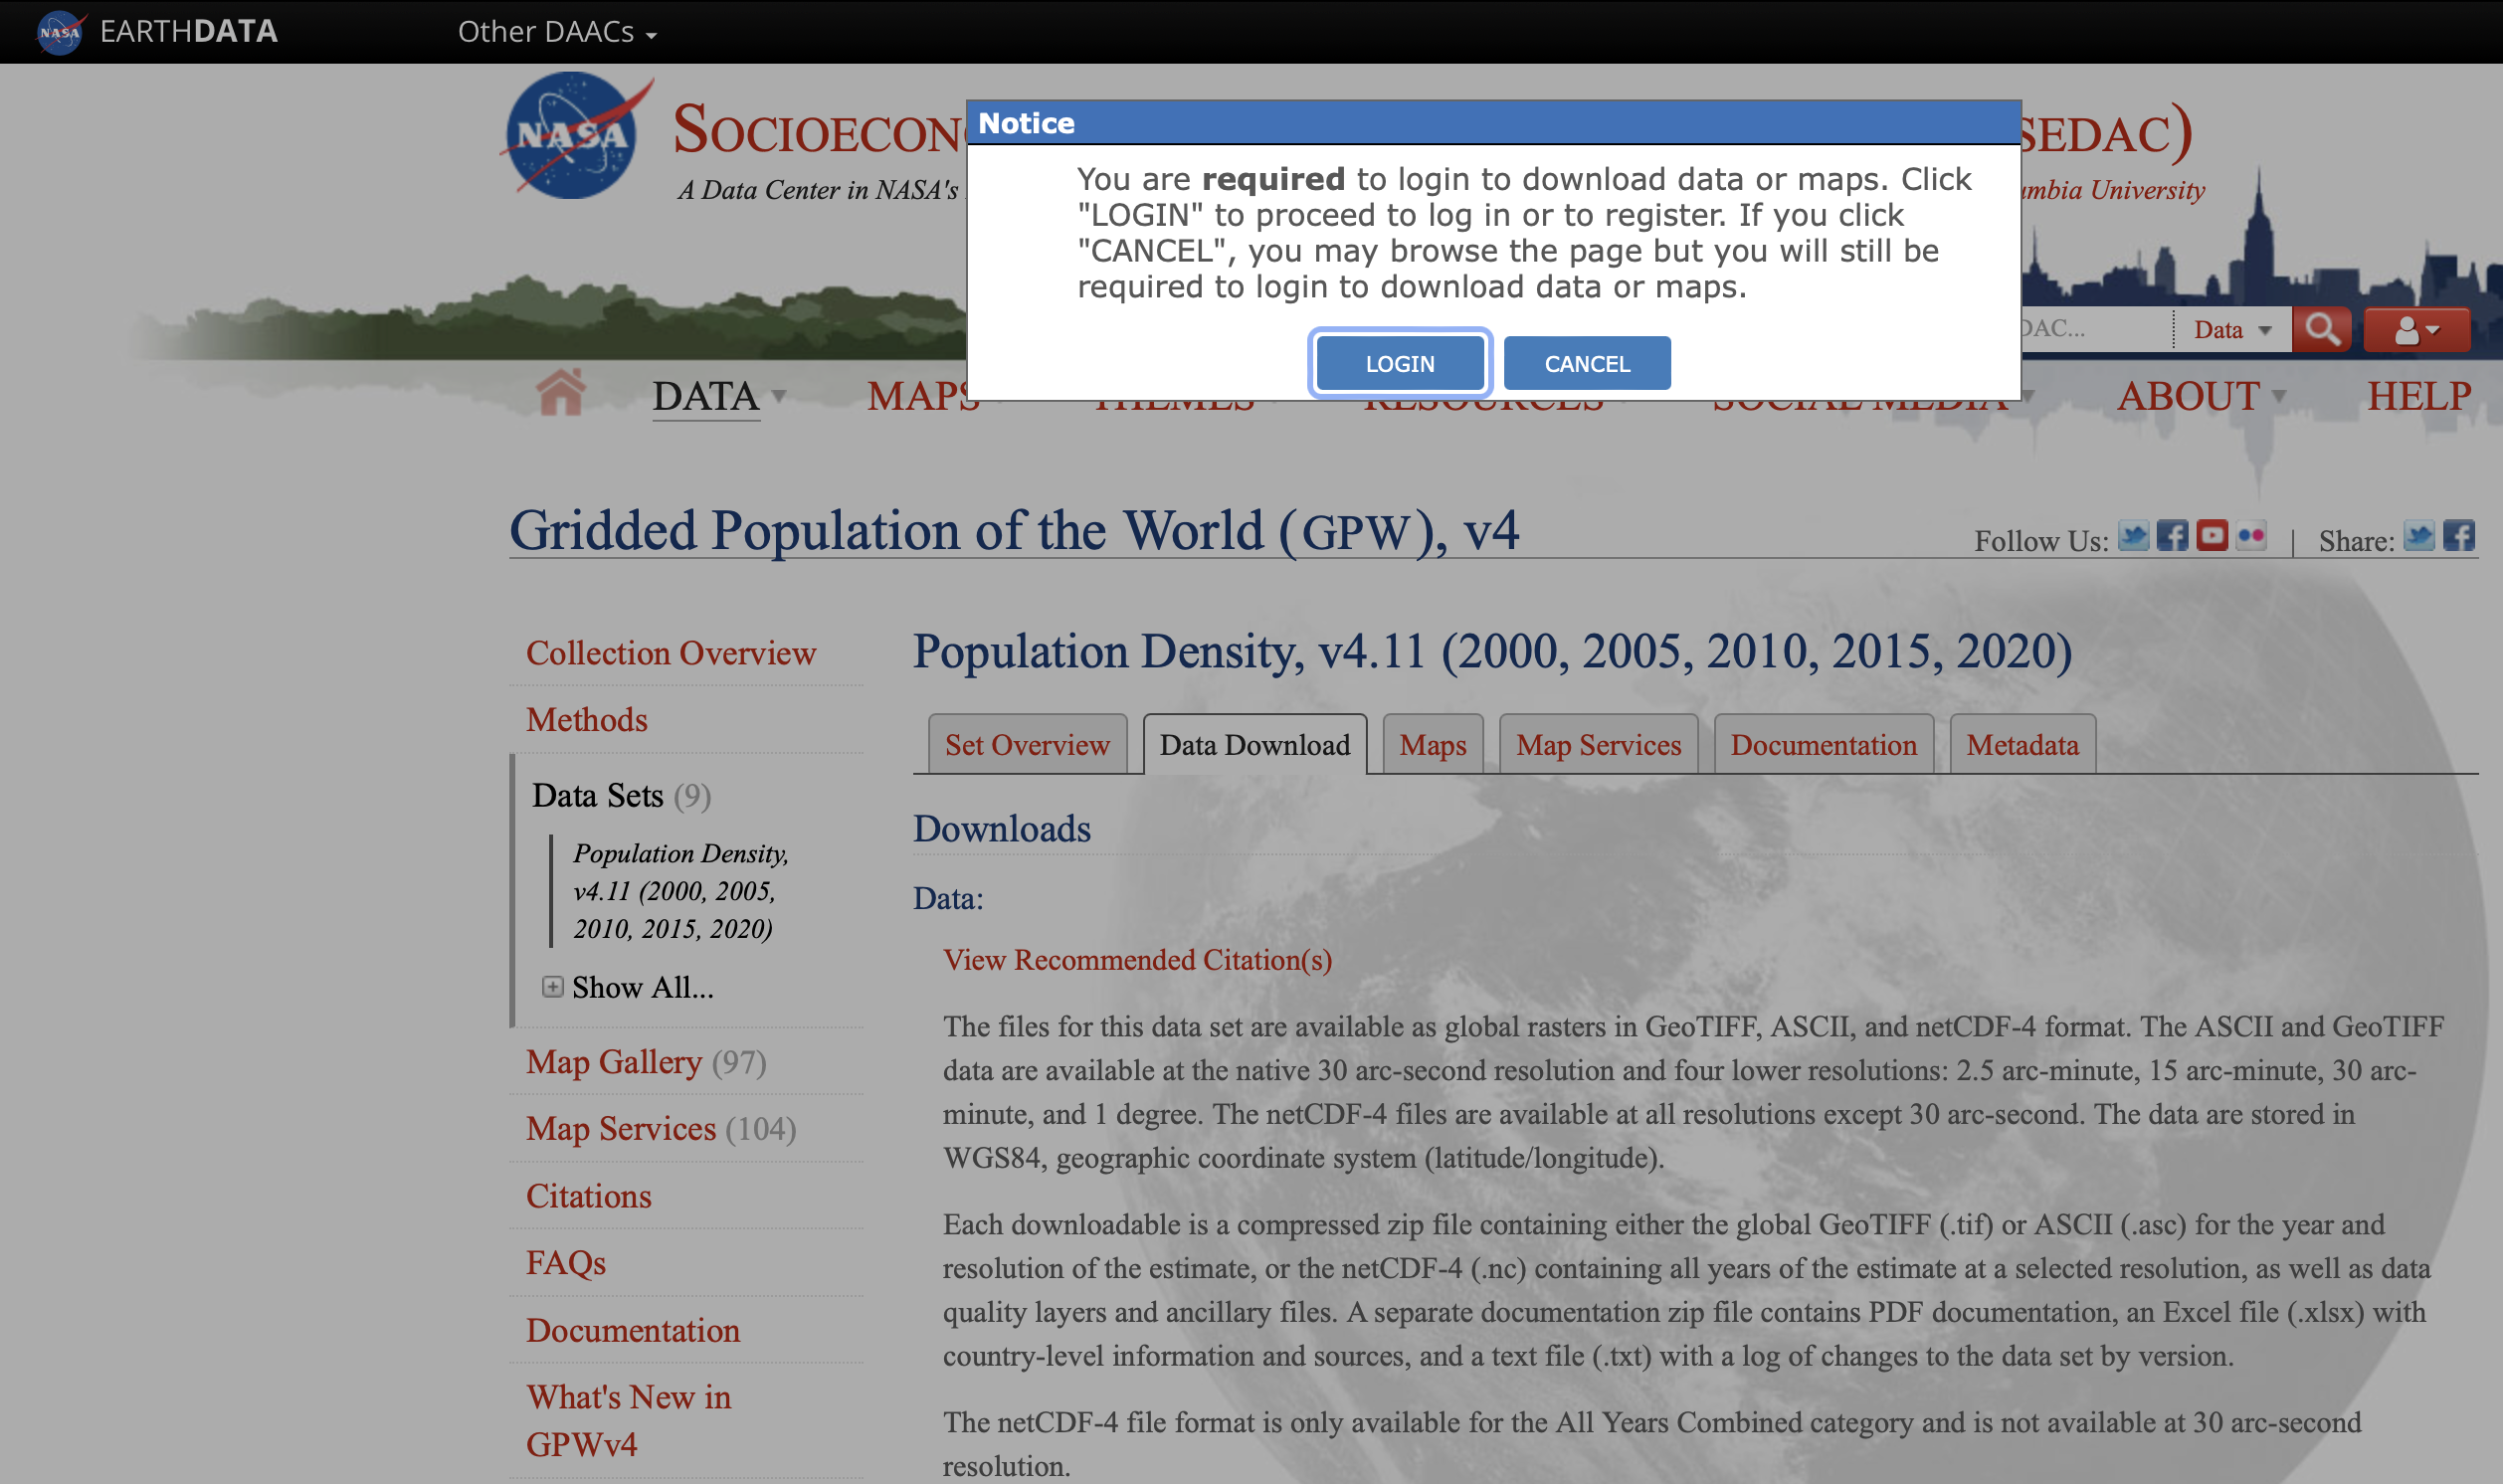
The Data: Population Raster
We can download population density from SEDAC.
The Data: Population Raster
We can download population density from SEDAC.
The Data: Population Raster
We can download population density from SEDAC.

The Data: Population Raster
We can download population density from SEDAC.
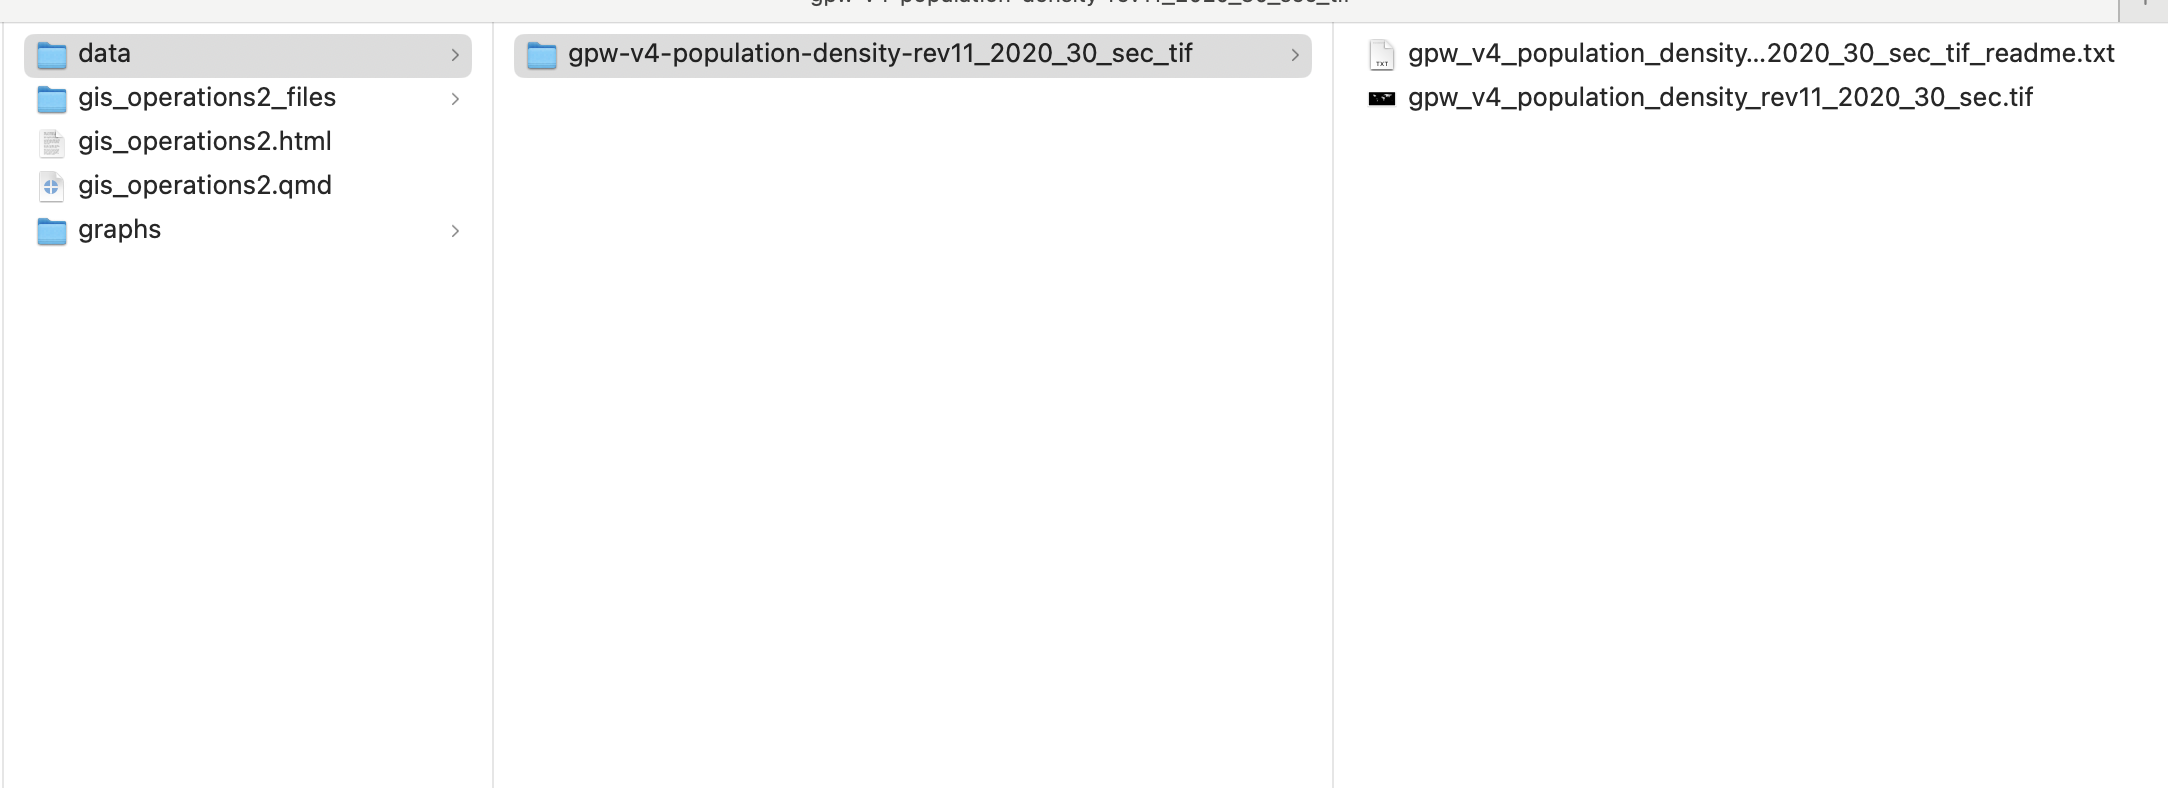
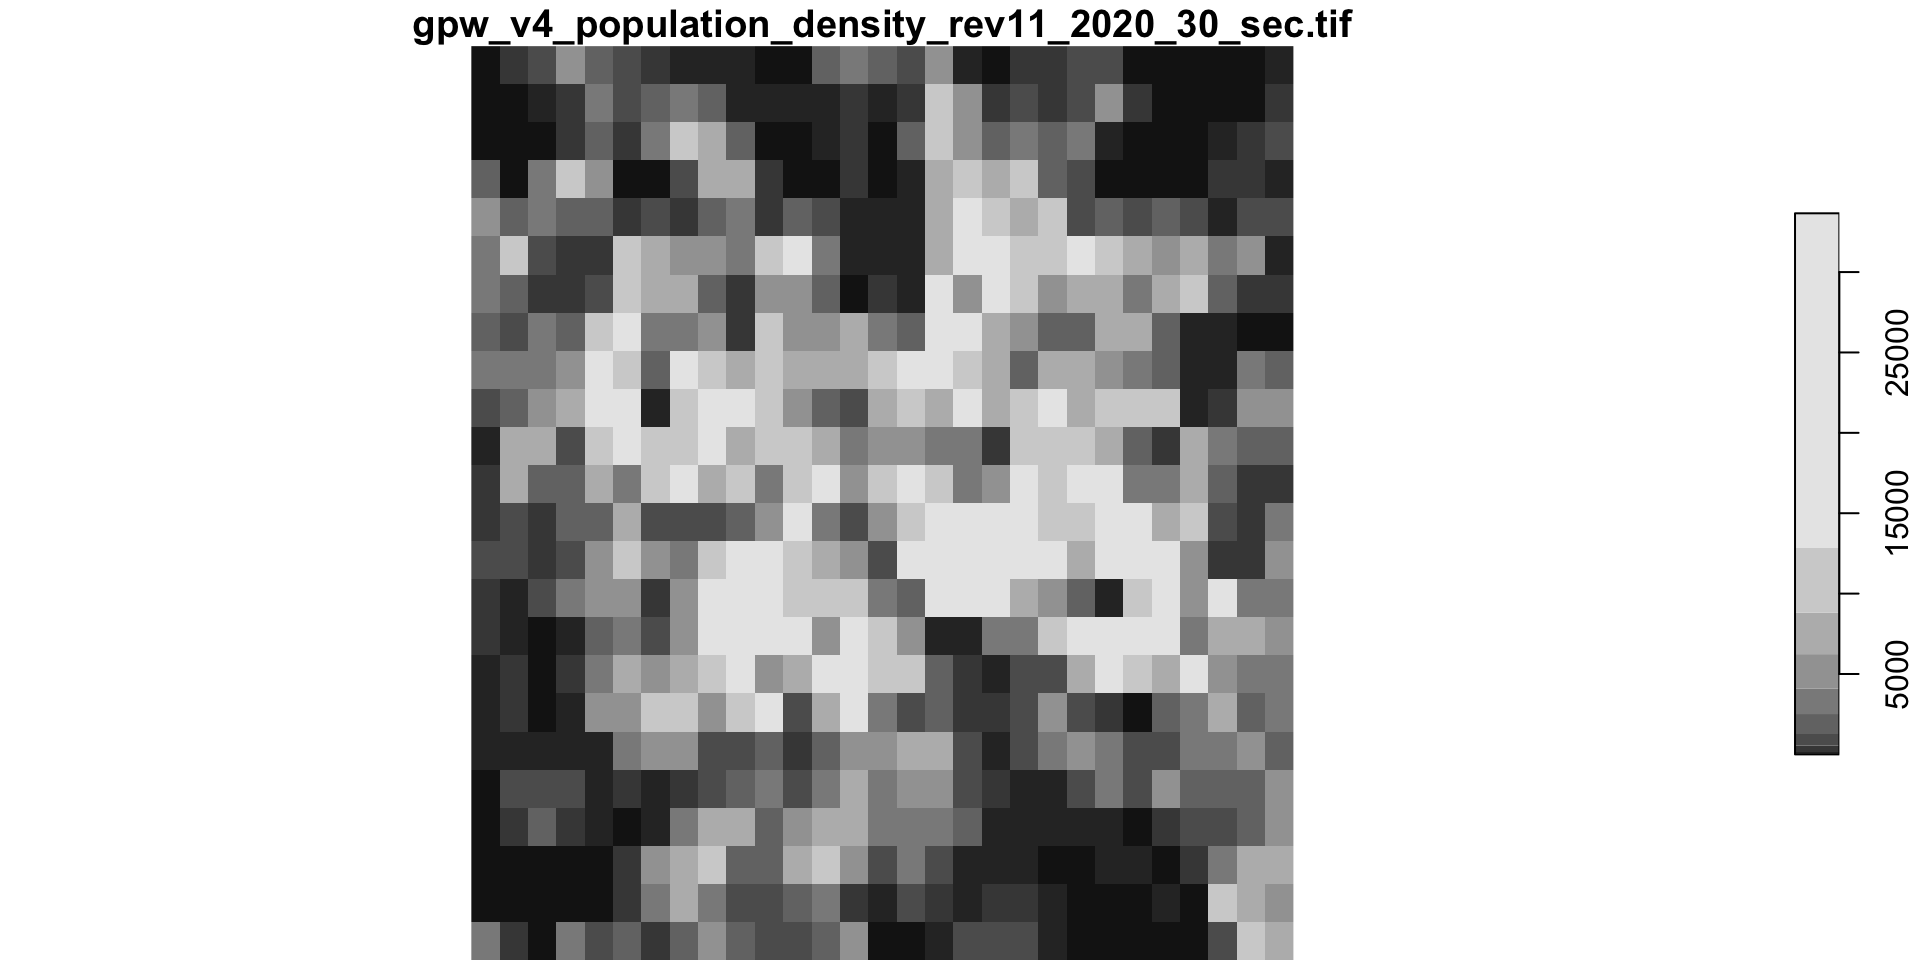
The Data: Population Raster
Reading the tif file
The Data: Population Raster
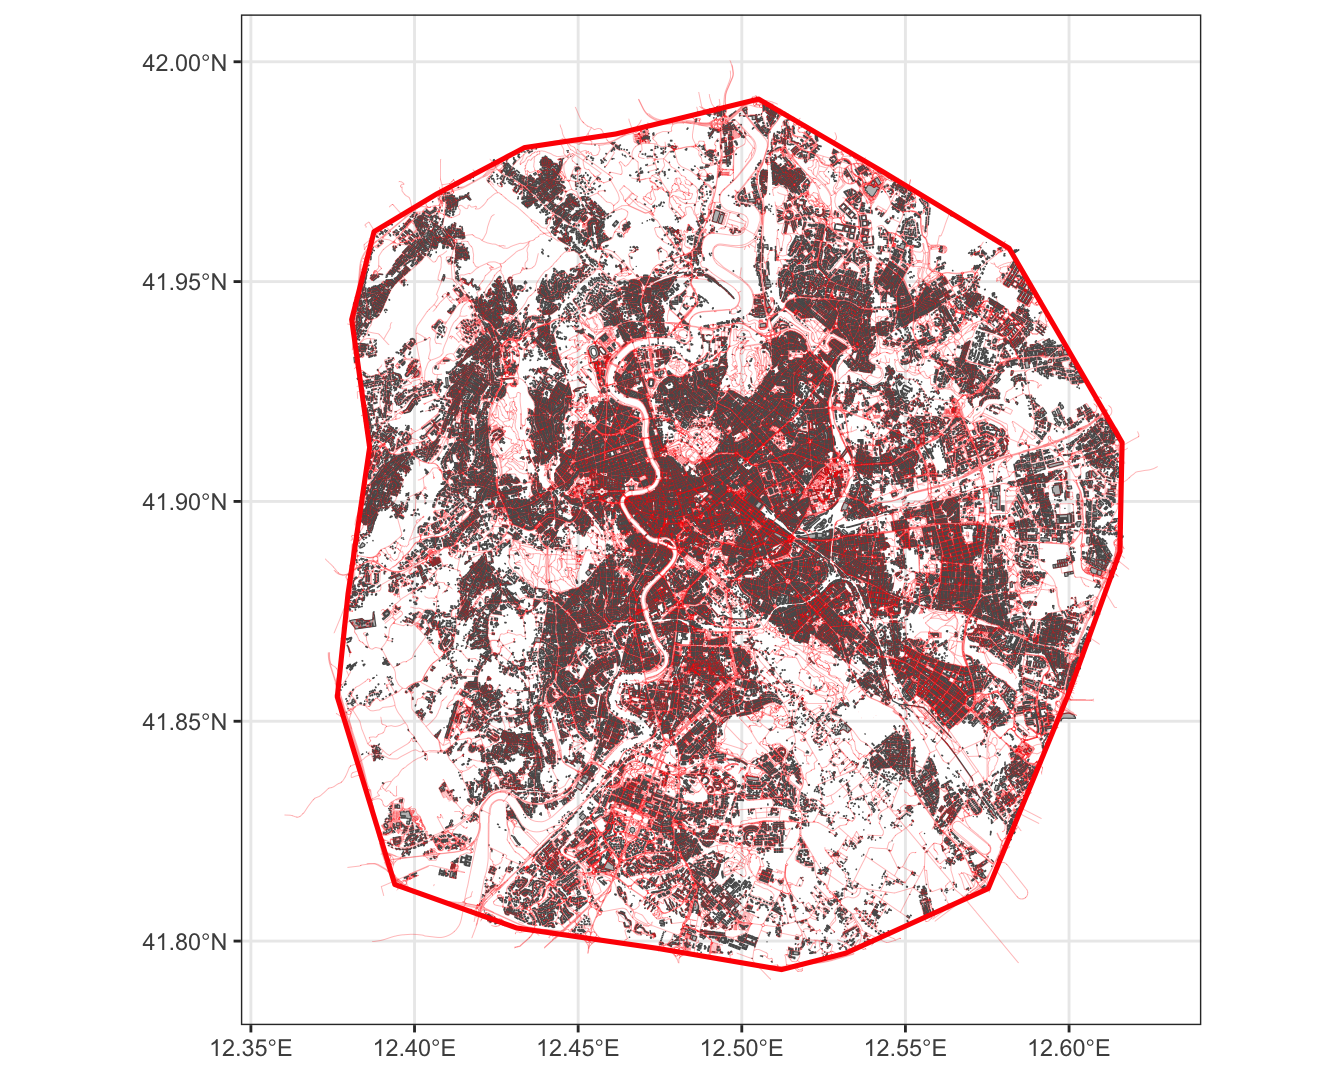
We now need to process the tif file to make it smaller (focus only on the region of interest).
Normal computers do not have enough memory to manipulate the data.
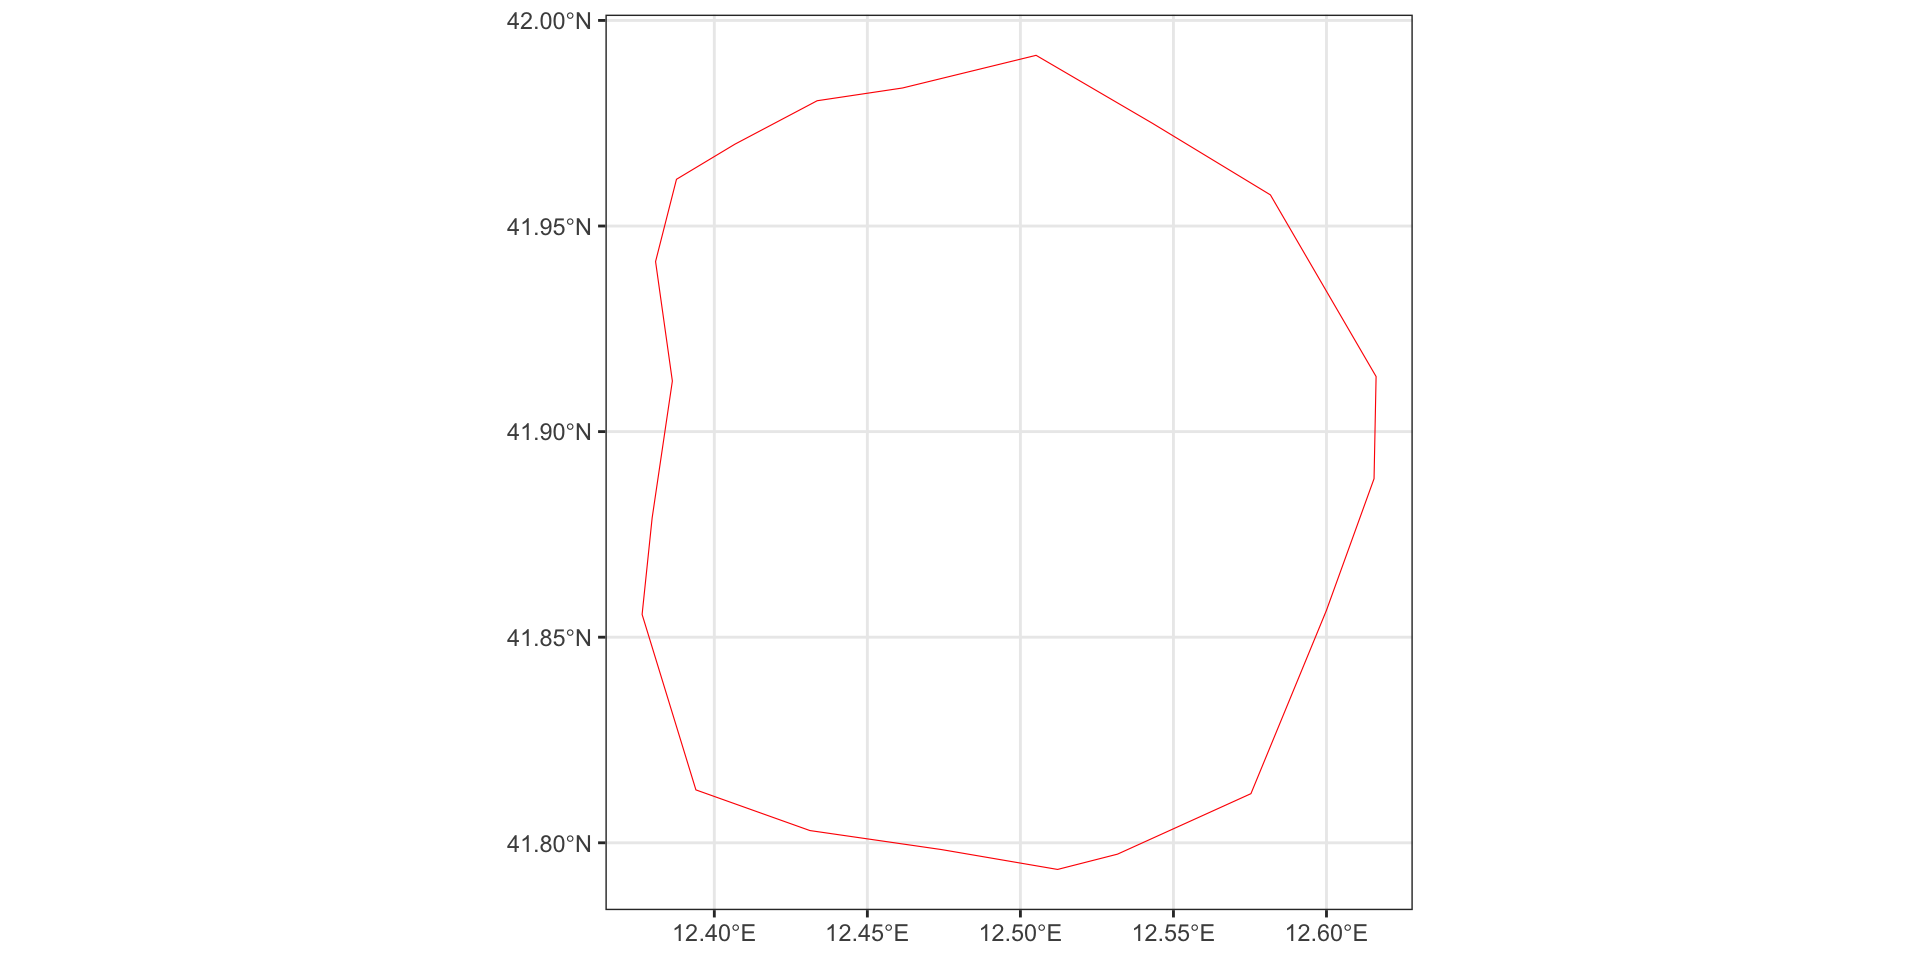
We will crop the world raster to only the tiny area around Rome.
This is the polygon depicted in red here.
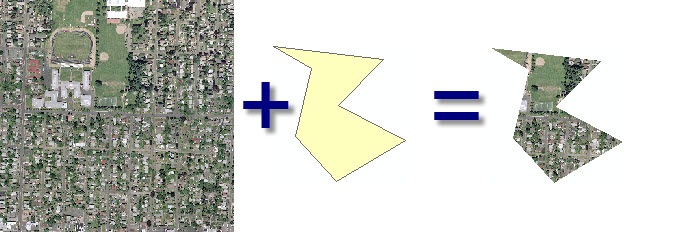
Clipping rasters
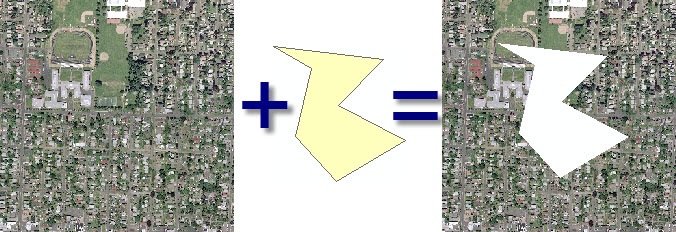
Clipping rasters
The Data: Population Raster
We first need to identify the maximum latitude and longitude of this polygon
The Data: Population Raster
To obtain the four points, we need to identify the extreme points of the the central Rome polygon.
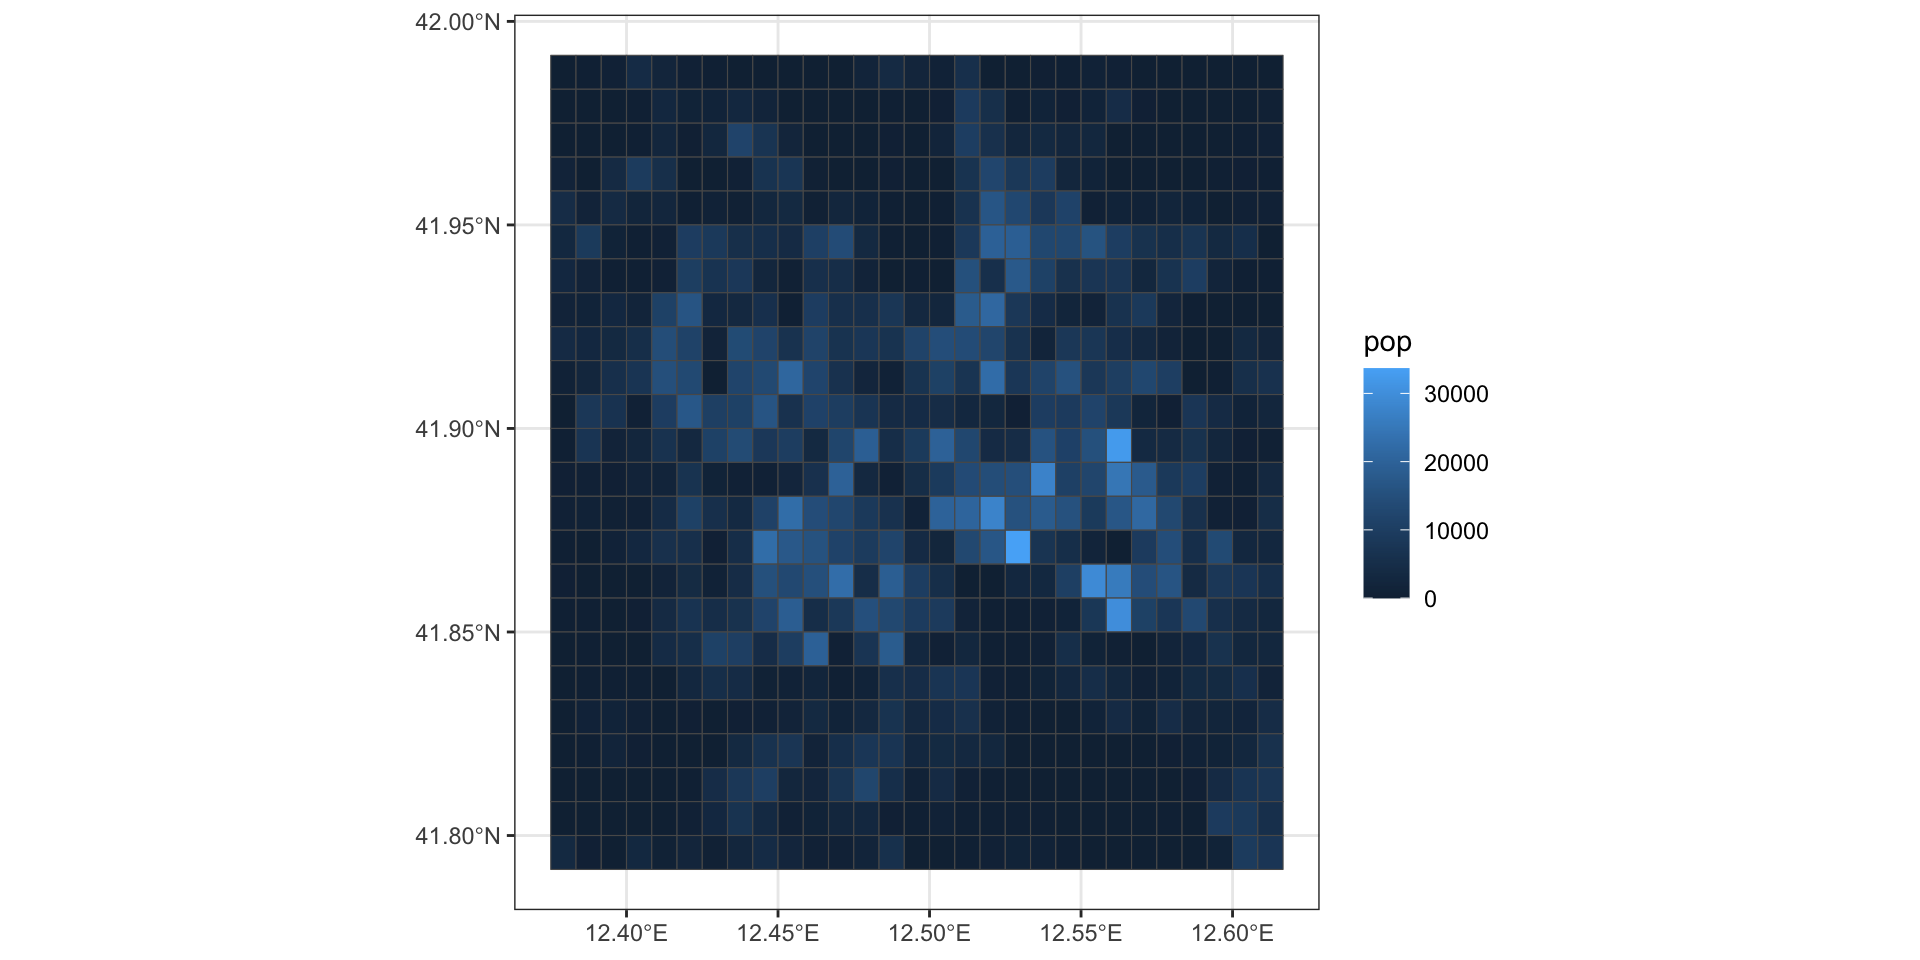
Cropping Population Raster
We now finally crop the raster
Cropping Population Raster
This is how the two rasters compare

Cropping Population Raster
This is how the two rasters compare

Turning a raster to gridded polygons
We now want to transform the picture (raster) into a feature polygon.
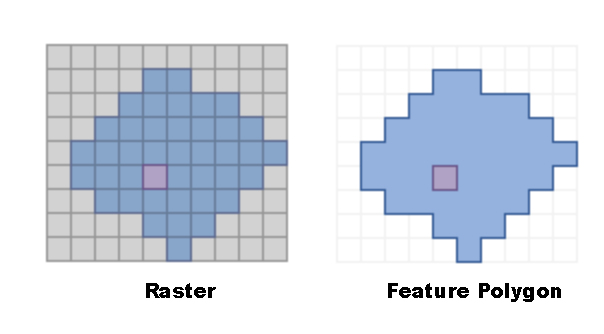
In our case, we want to turn our raster into polygon grids.
Turning a raster to gridded polygons
In our case, there are no differences between a raster and a polygon feature based on that raster.
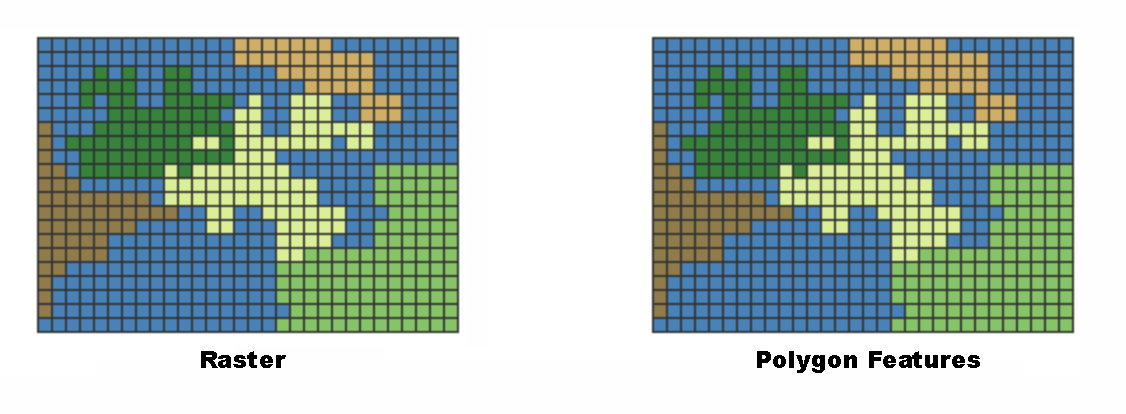
Turning a raster to gridded polygons
Visually, there are no differences between a raster and a polygon feature based on that raster.
However, the raster is a picture (tif file), while the polygon feature is a shape file.
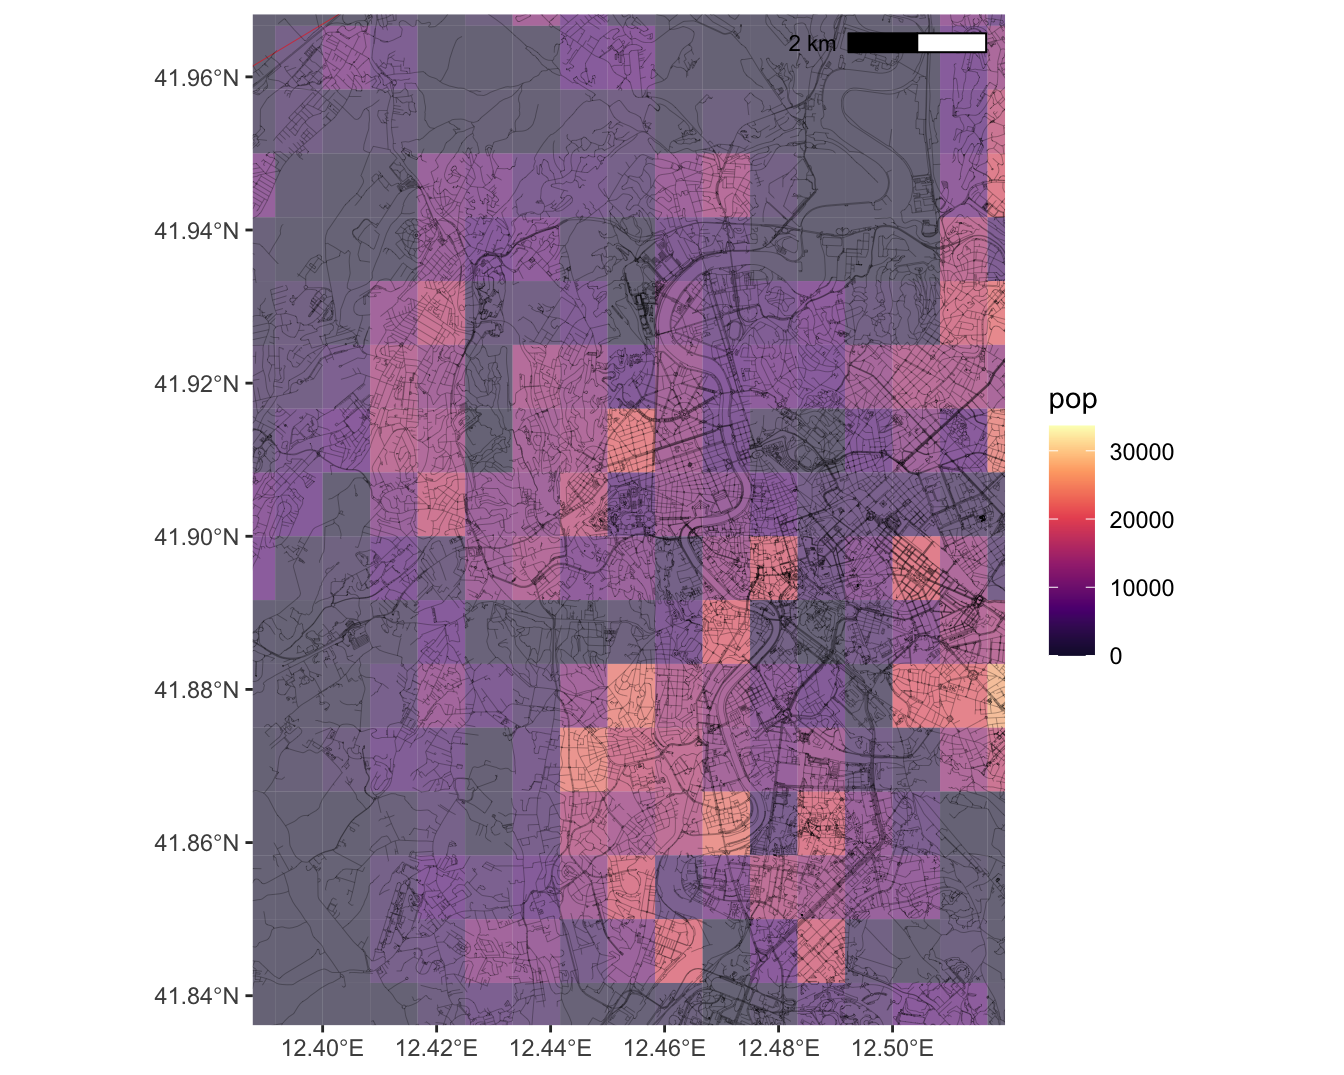
Turning Raster to Grid
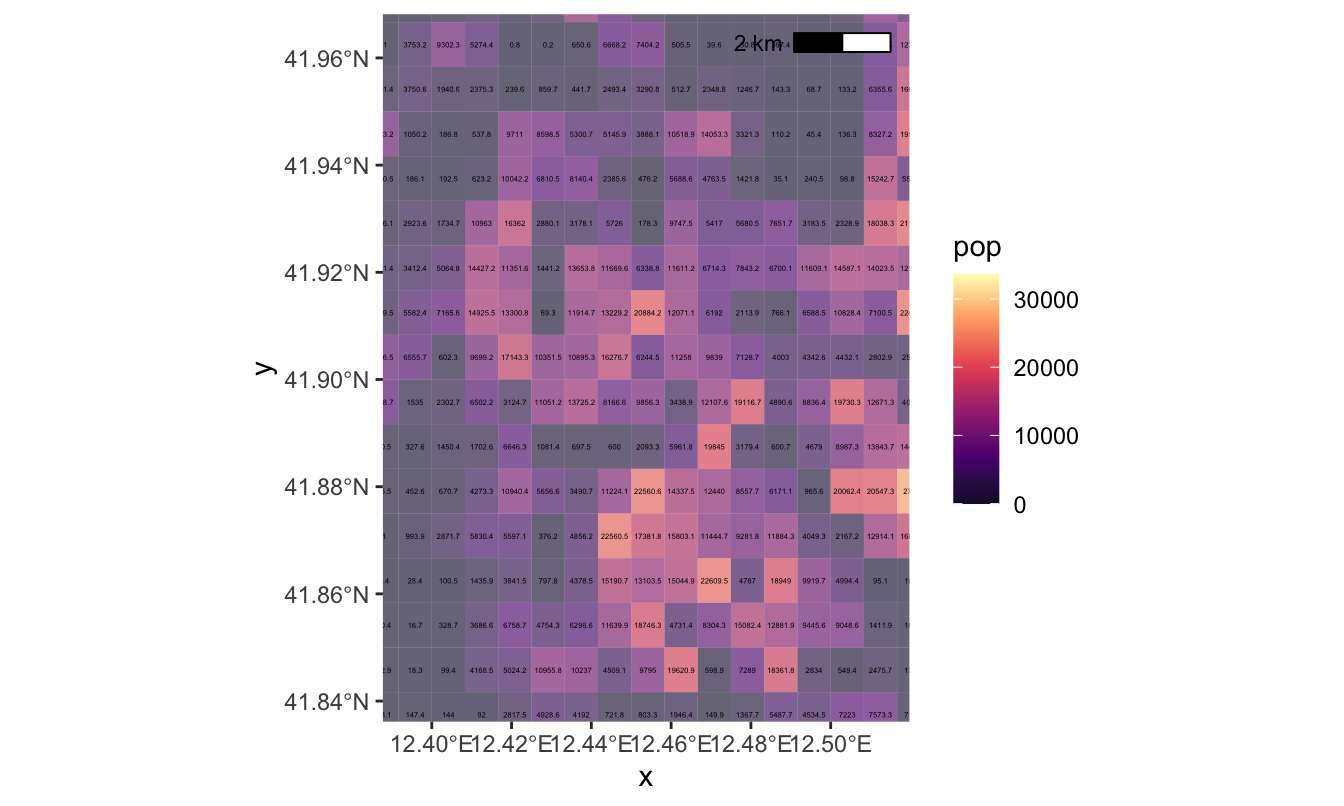
We can now map the new grid
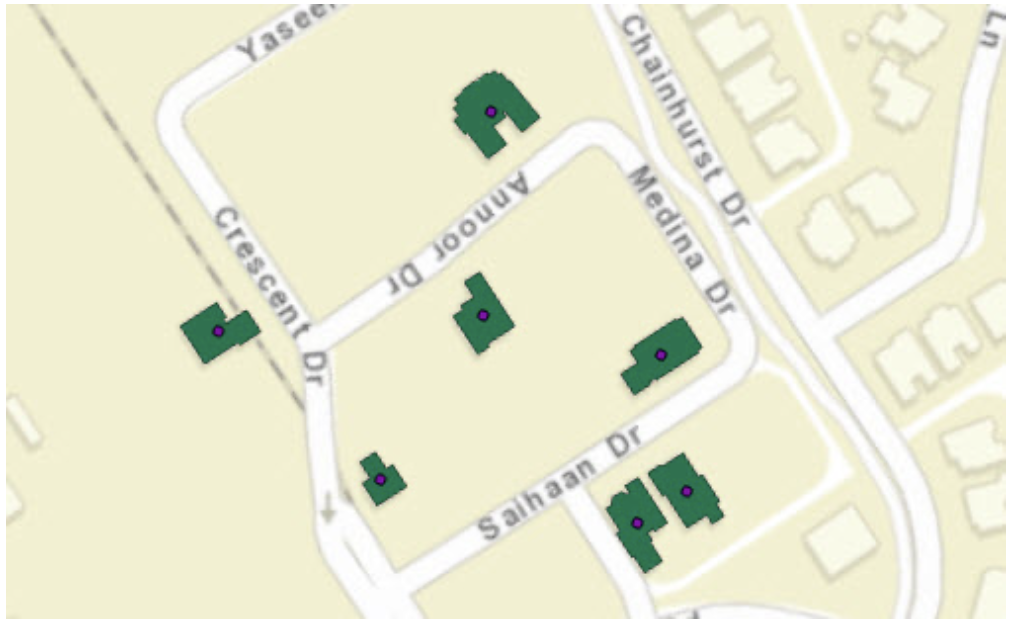
Calculating grid centroids
We can calculate grid centroid in order to display the value of the raster.
Calculating grid centroids
We can calculate grid centroid in order to display the value of the raster.
Making a grid
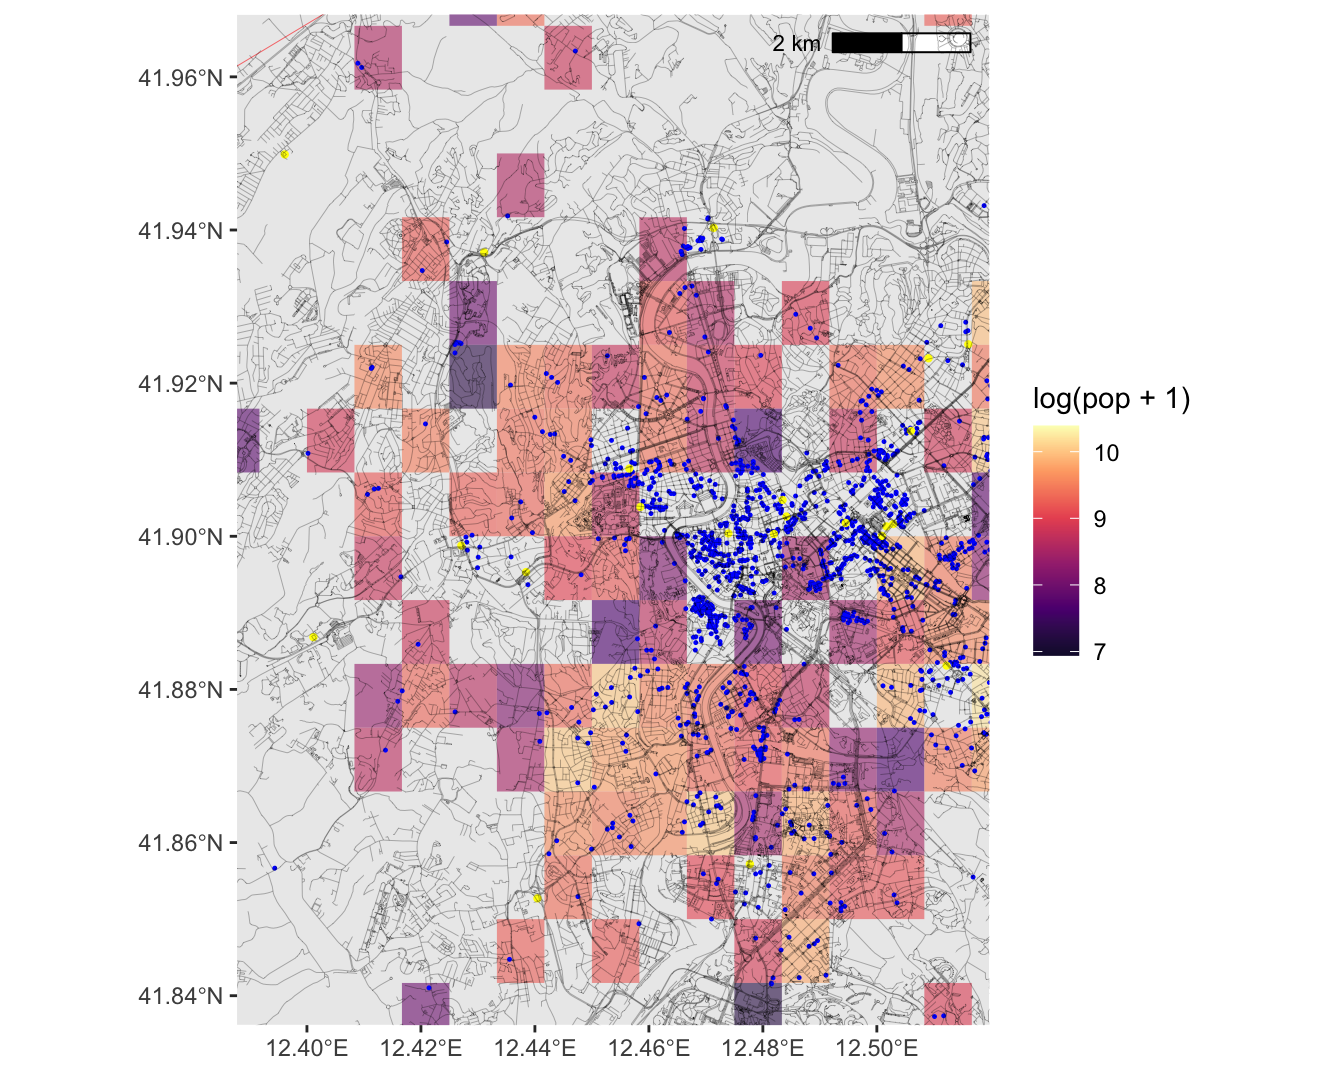
Mapping grid values
Making a grid
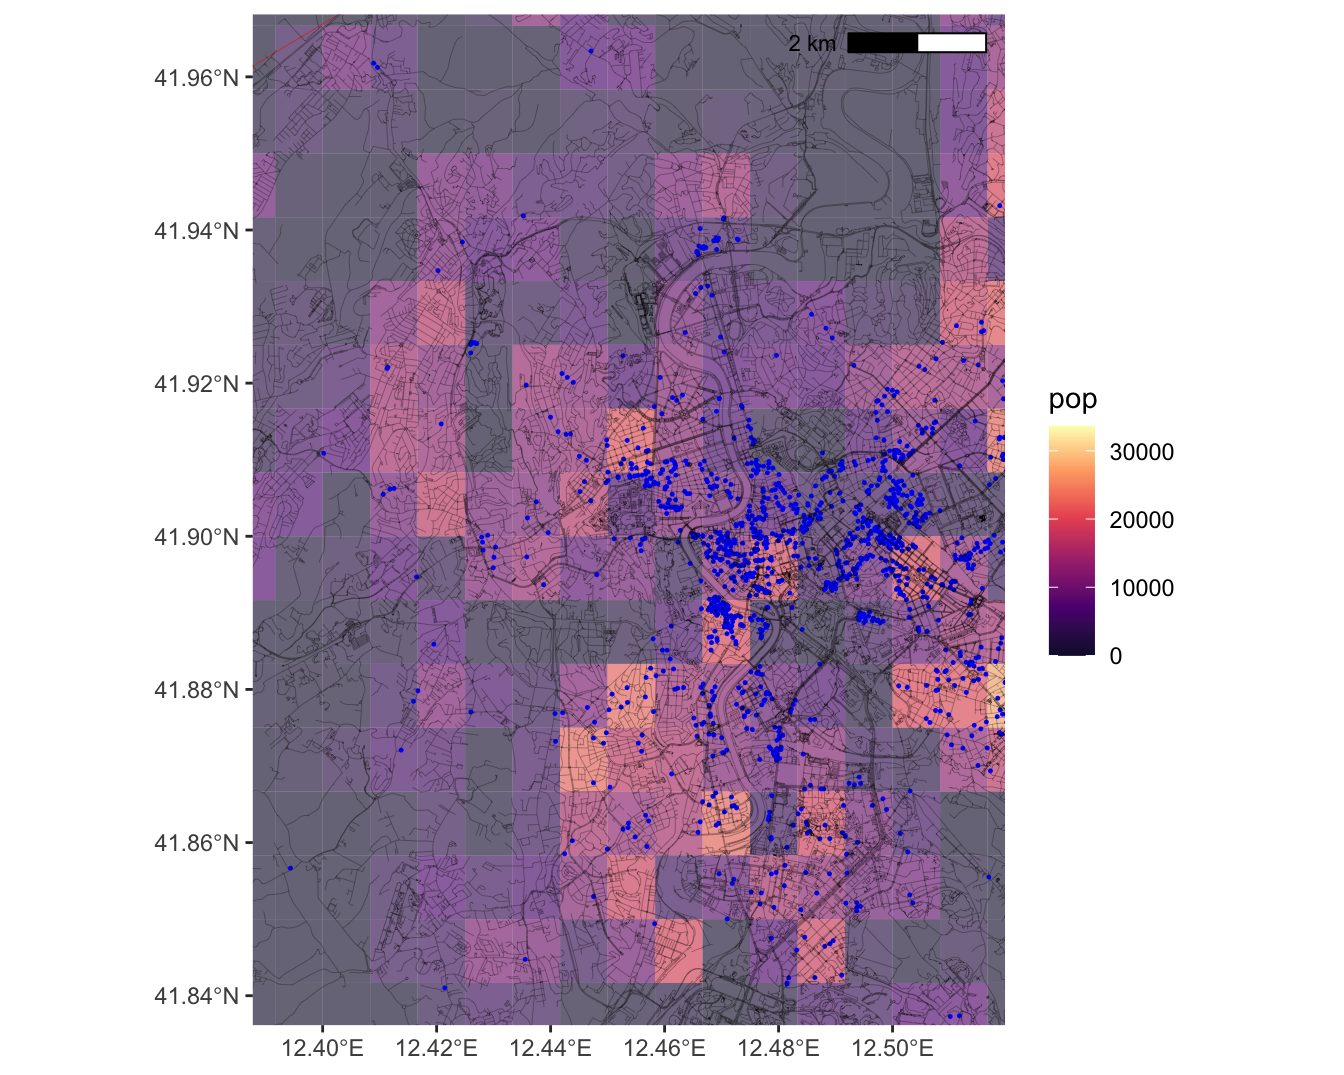
Loading restaurants
McDonalds

Mapping Restaurant density
Mapping restaurants in a grid:
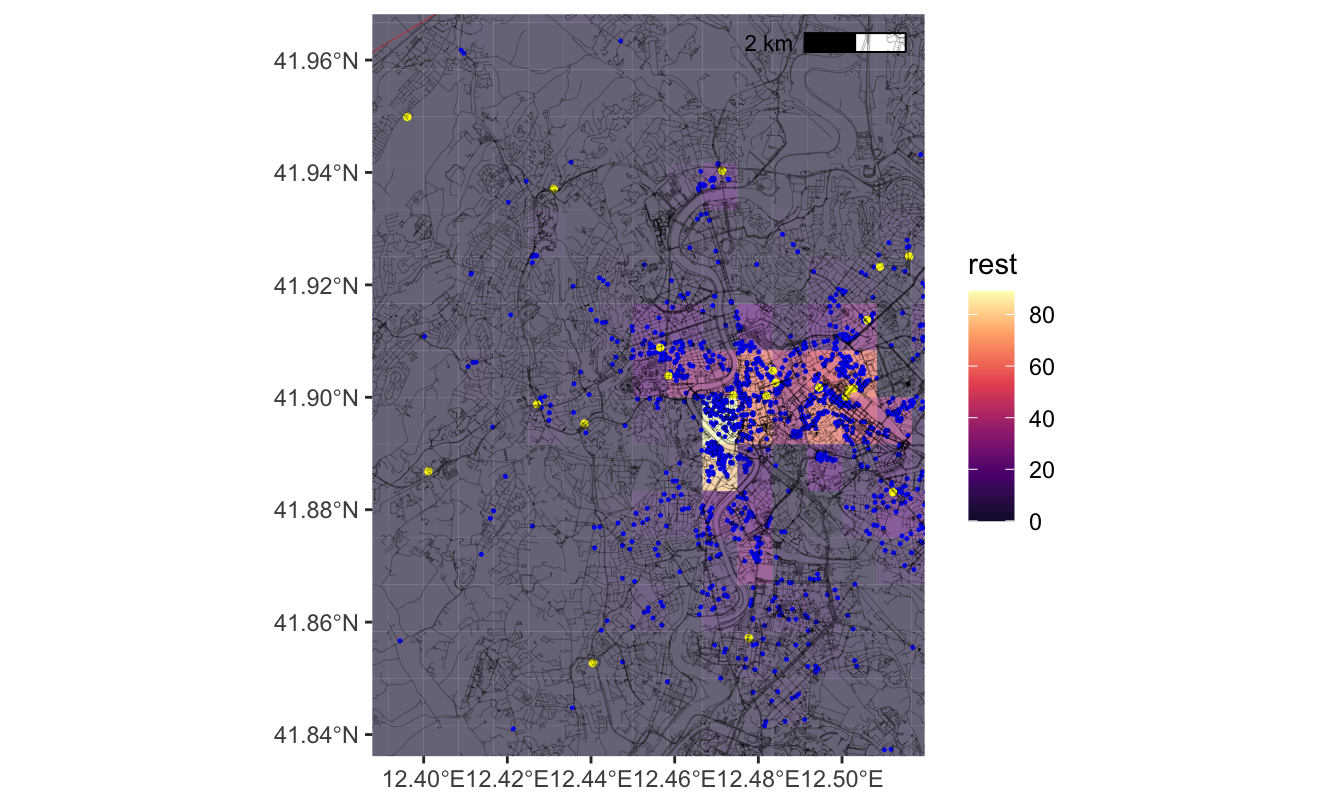
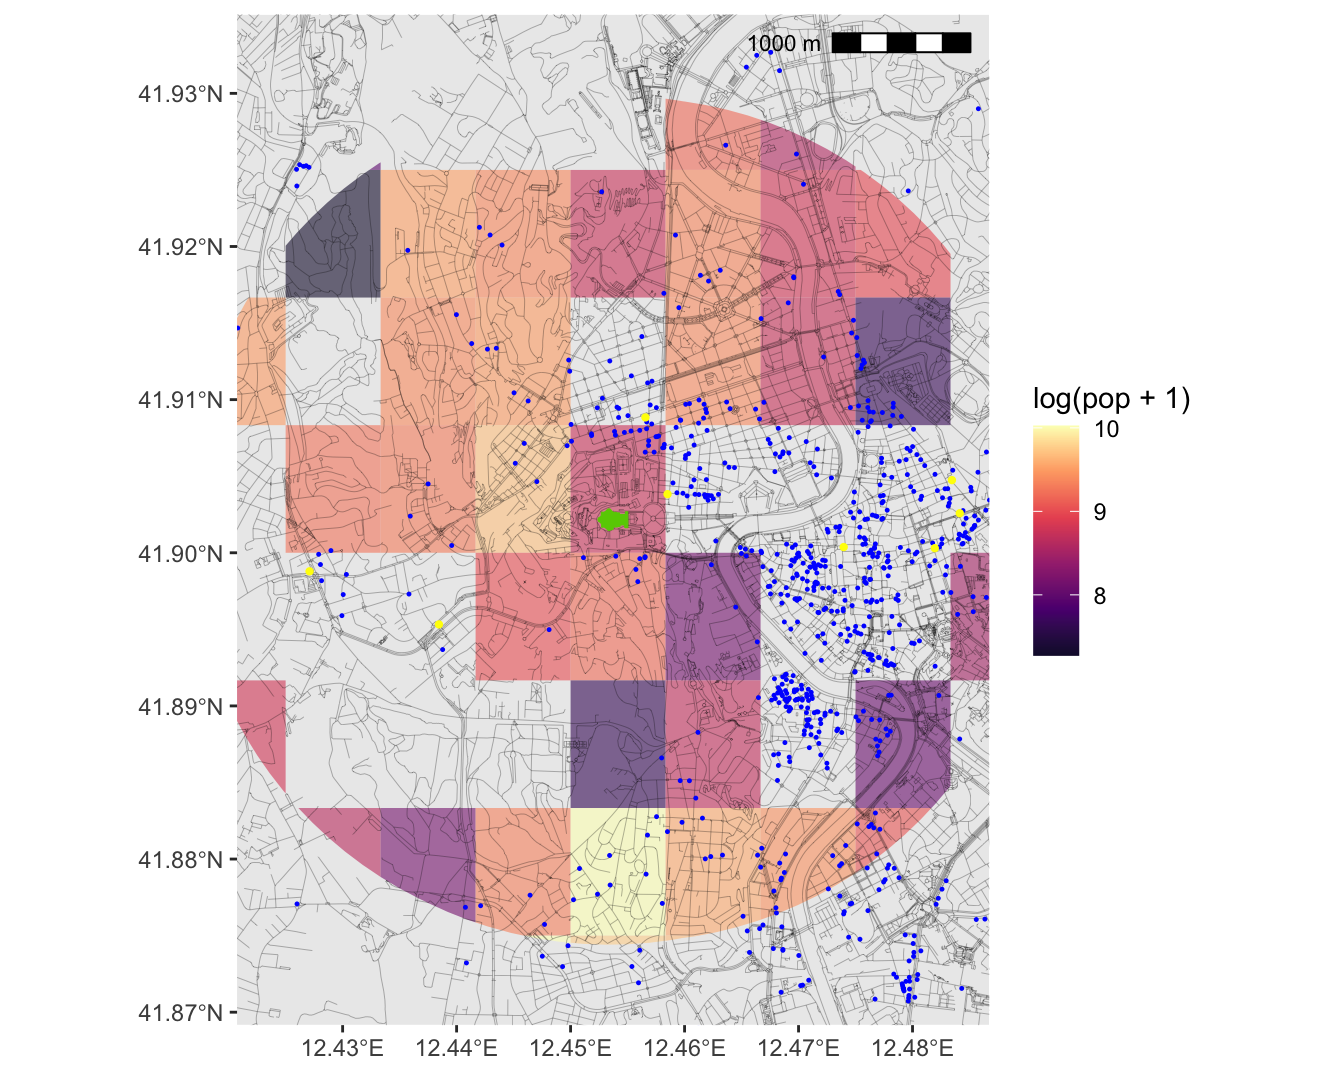
Mapping Restaurant density
Mapping log restaurants + 1 in a grid:
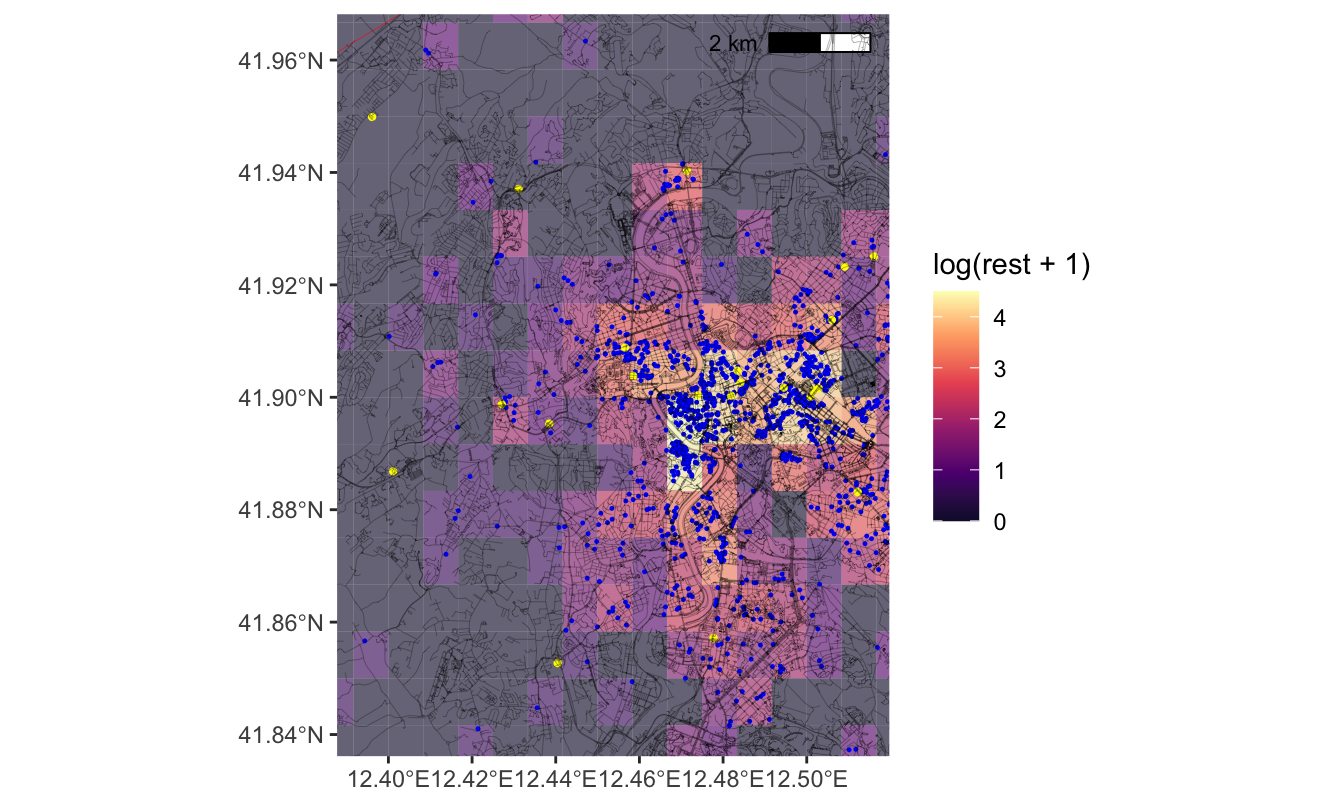
Mapping Restaurant density
Notice the difference
Show Code
library(ggpubr)
library(lemon)
fig1<-ggplot()+
  geom_sf(data=g3, aes(fill=rest), color=NA, alpha=0.6)+
  scale_fill_viridis_c(option = "magma",begin = 0.1)+
  geom_sf(data=relev_poly, linewidth = 0.1, fill = NA, color = "red", alpha=0.5)+
  geom_sf(data=restaurants2, color="blue", size=0.2)+
  geom_sf(data=mcdon, color="yellow", size=0.8)+
    ggspatial::annotation_scale(location = 'tr')+
    geom_sf(data=gis_osm_roads, linewidth = 0.1, color = "black", alpha=0.5)+
    coord_sf(xlim = c(min_lon_x - error, max_lon_x + error),
           ylim = c(min_lat_y - error, max_lat_y + error))+
  theme(axis.title = element_blank(),   # Remove axis titles
        axis.ticks = element_blank(),
        legend.box.background = element_rect(fill = "white",
                                             linewidth=0.5, linetype="solid",
                                             colour = "black"),
        legend.position = c(0, 1),
        legend.justification = c(0, 1))


fig2<-ggplot()+
  geom_sf(data=g3, aes(fill=log(rest+1)), color=NA, alpha=0.6)+
  scale_fill_viridis_c(option = "magma",begin = 0.1)+
  geom_sf(data=relev_poly, linewidth = 0.1, fill = NA, color = "red", alpha=0.5)+
  geom_sf(data=restaurants2, color="blue", size=0.2)+
  geom_sf(data=mcdon, color="yellow", size=0.8)+
    ggspatial::annotation_scale(location = 'tr')+
    geom_sf(data=gis_osm_roads, linewidth = 0.1, color = "black", alpha=0.5)+
    coord_sf(xlim = c(min_lon_x - error, max_lon_x + error),
           ylim = c(min_lat_y - error, max_lat_y + error))+
  theme(axis.title = element_blank(),   # Remove axis titles
        axis.ticks = element_blank(),
        legend.box.background = element_rect(fill = "white",
                                             linewidth=0.5, linetype="solid",
                                             colour = "black"),
        legend.position = c(0, 1),
        legend.justification = c(0, 1))

ggarrange(fig1, fig2, ncol=2)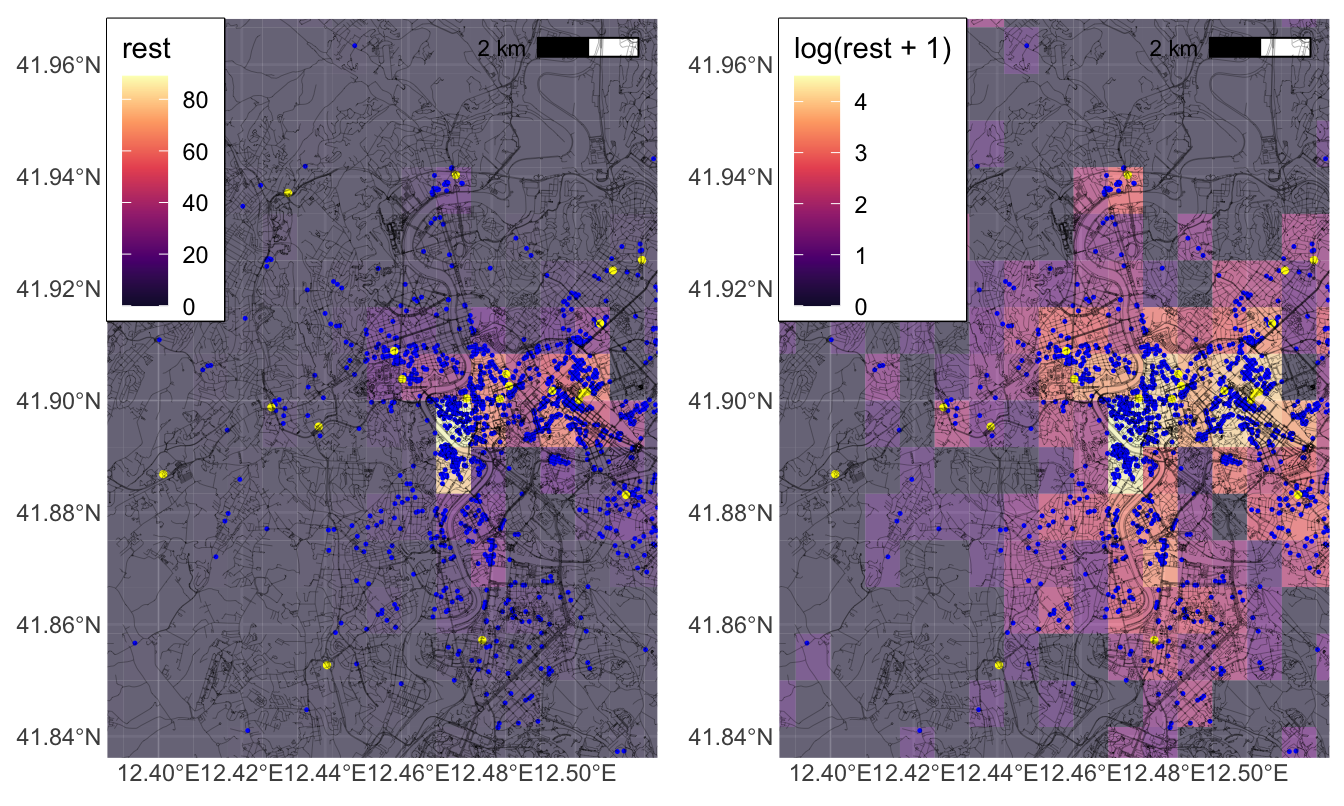
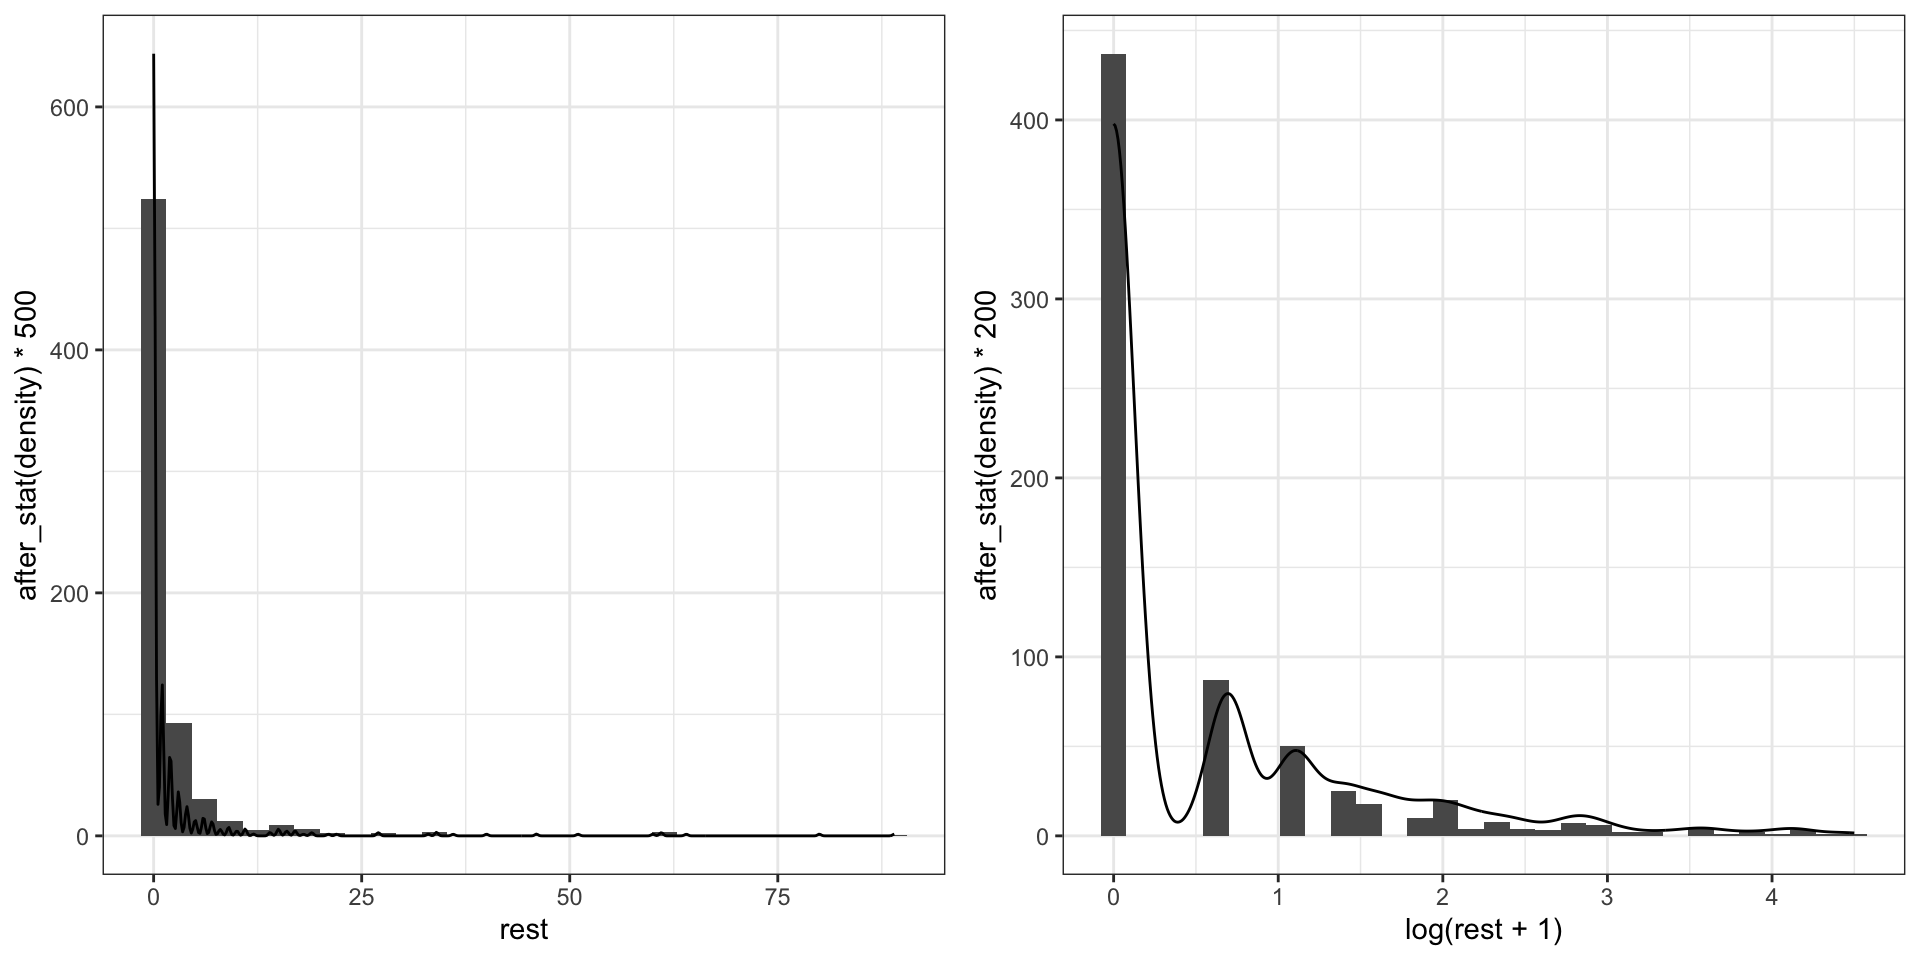
Mapping Restaurant density
Notice also the difference in the distribution of the two
Show Code
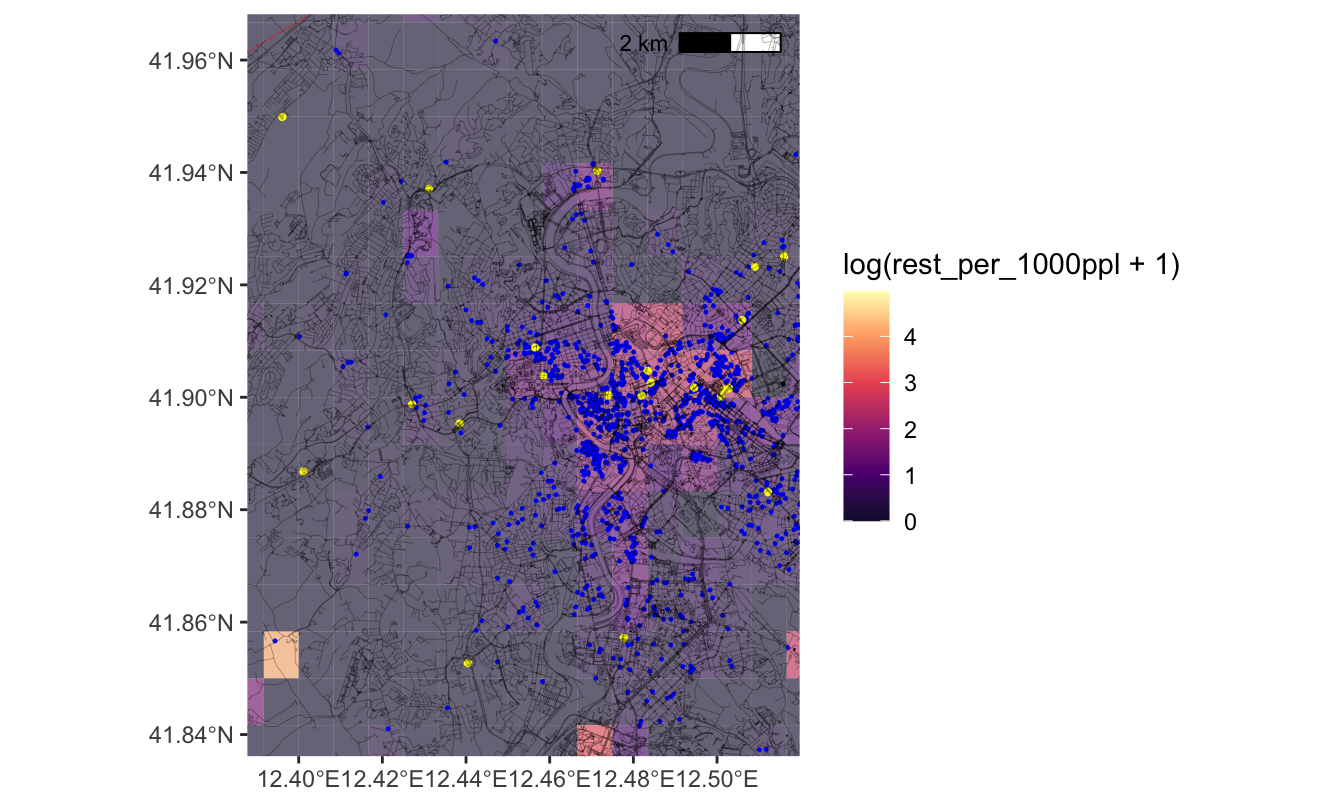
Mapping Restaurant density
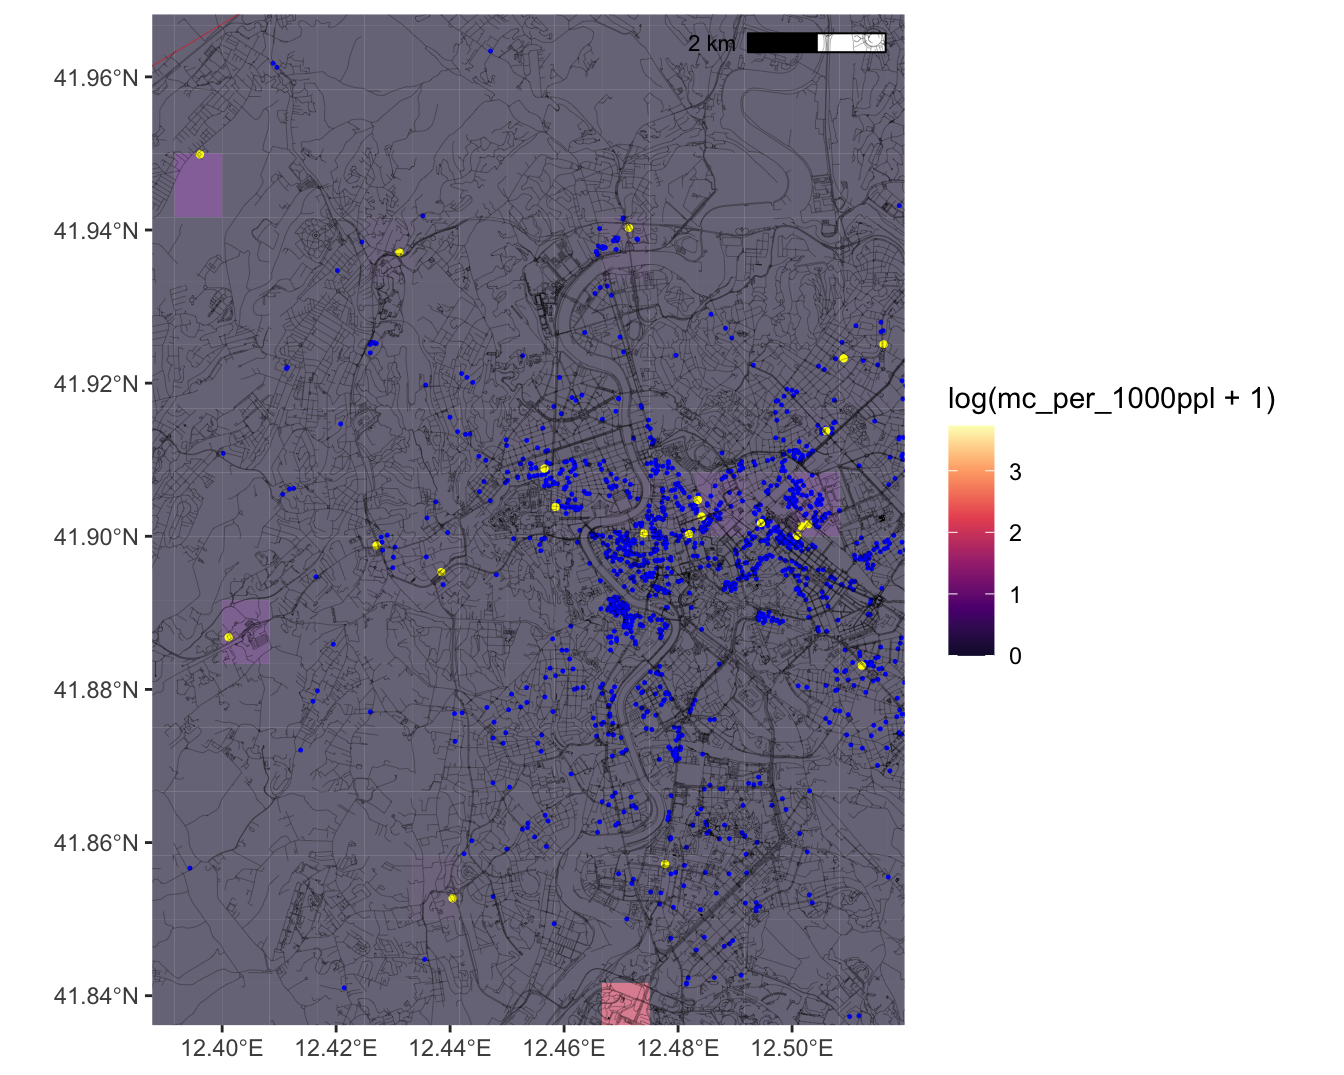
Mapping log restaurants per thousand people + 1 in a grid:
Mapping Restaurant density
Mapping log McDonald’s restaurants per thousand people + 1 in a grid:
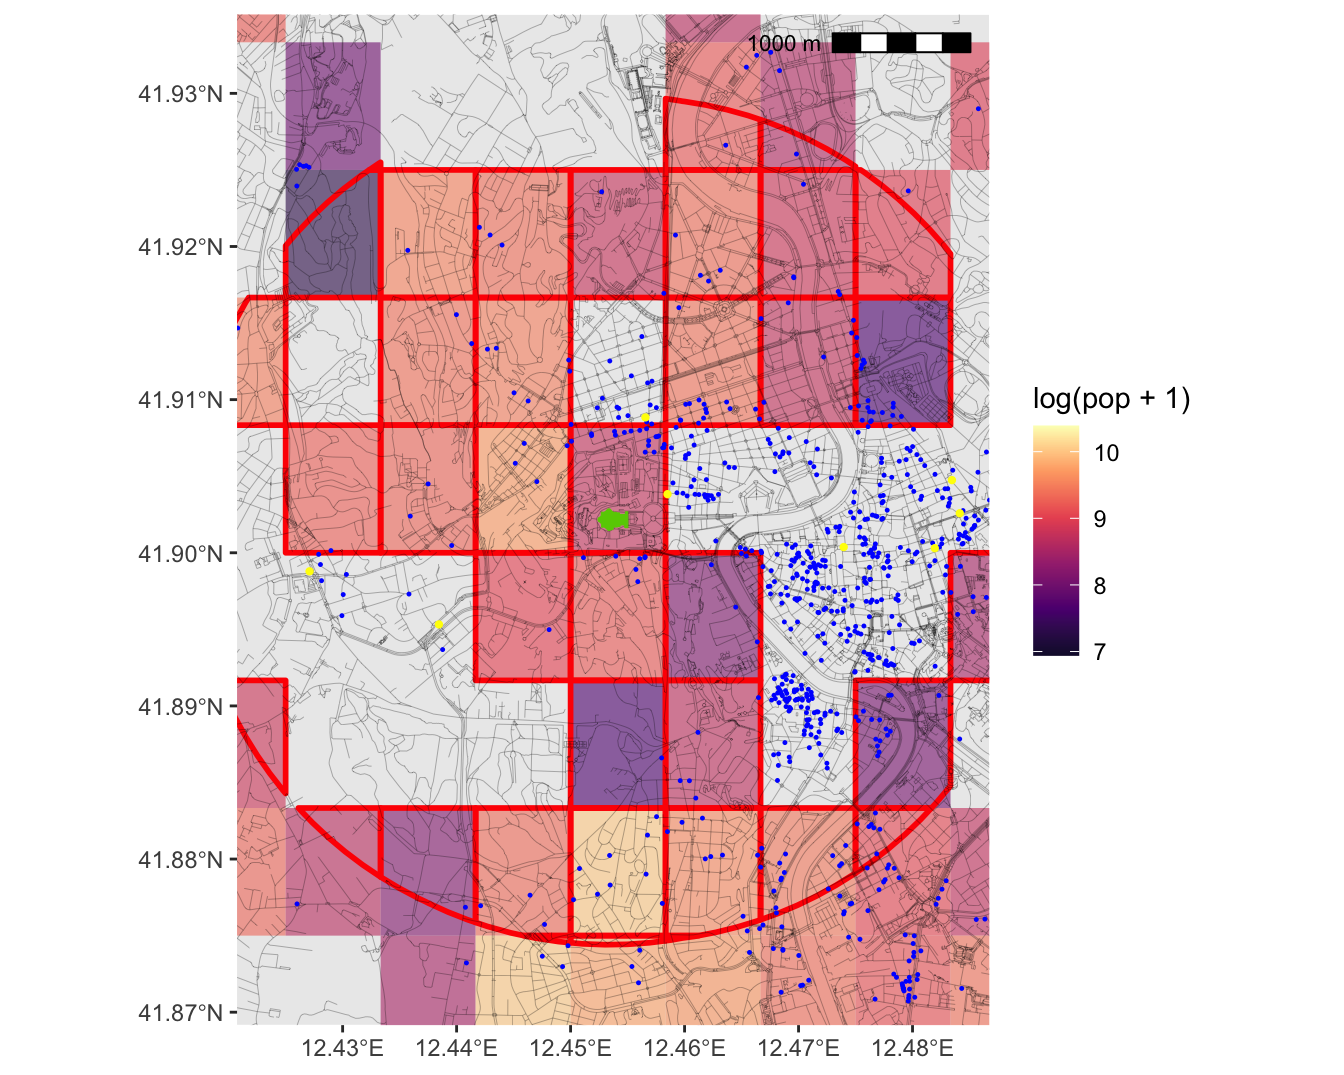
Mapping Restaurant density
Mapping Restaurant density
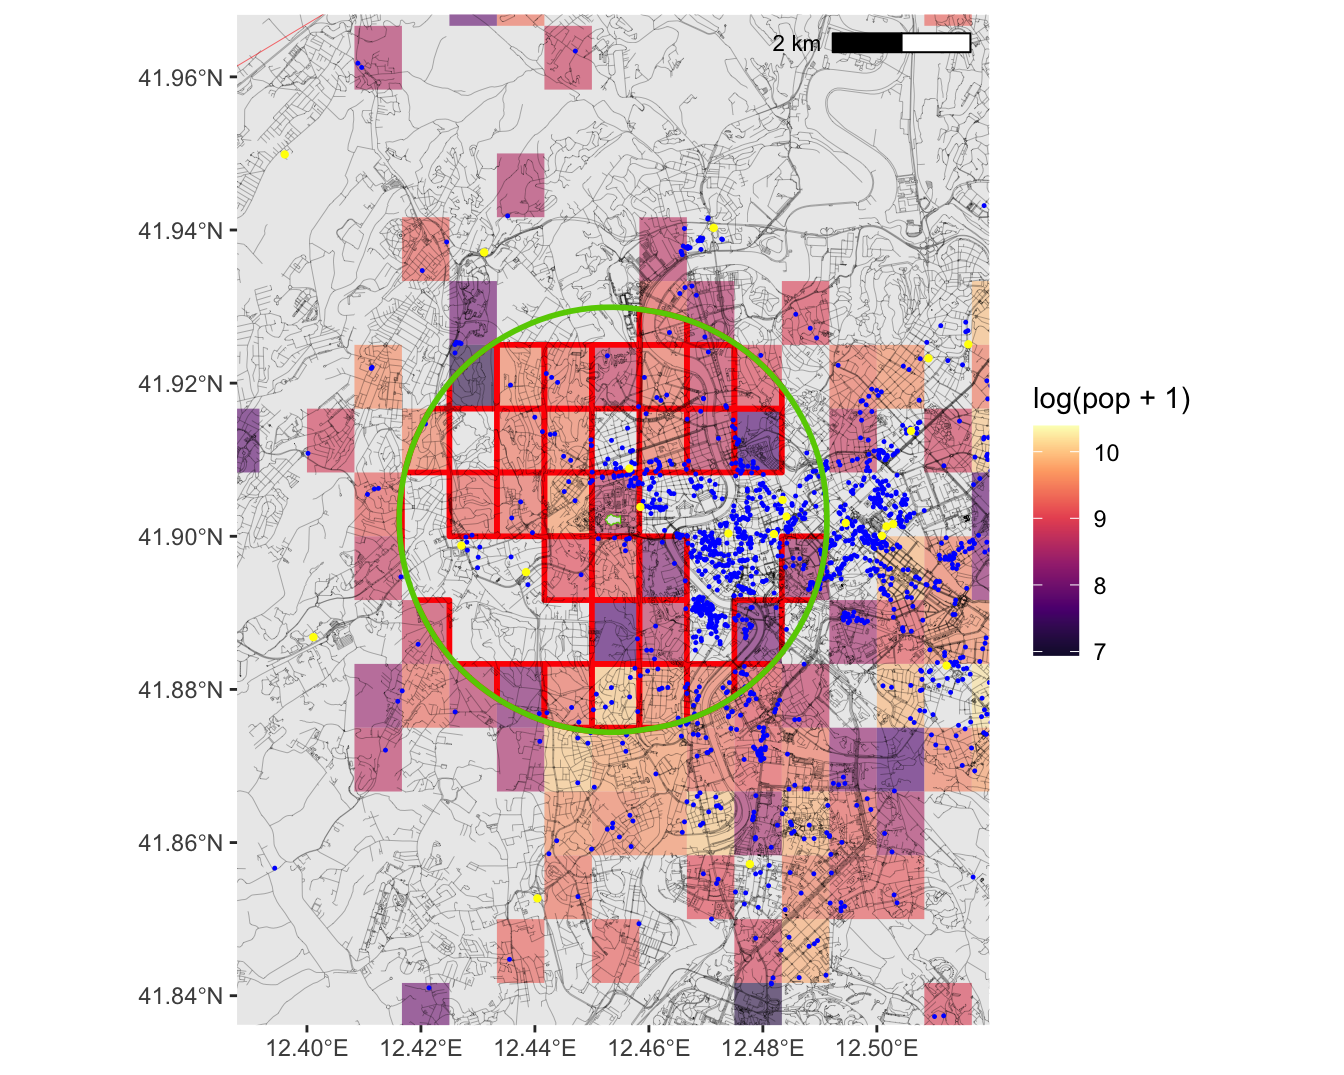
Finally, we want something within 3 km from the Vatican

Plotting the Buffer

Intersecting Polygons with Buffer
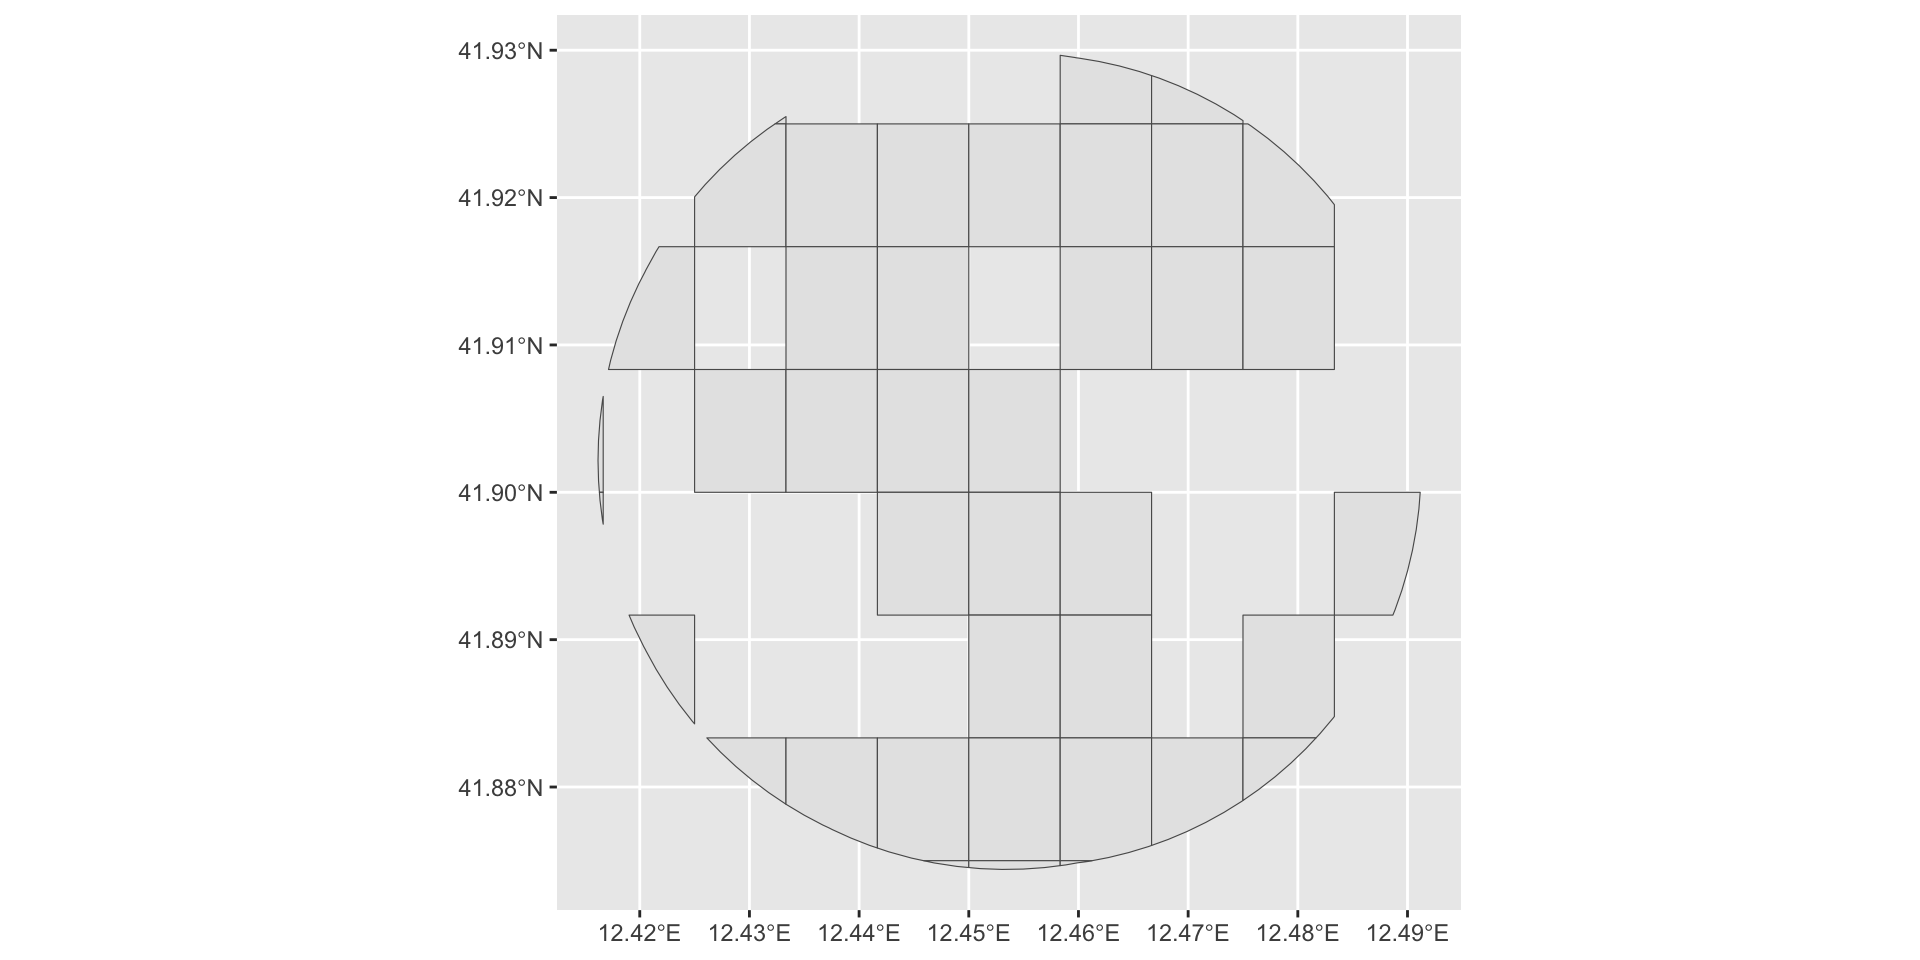
Plotting the Intersect
Final Product
Let us now simply plot those areas
Final Product
Let us now simply plot those areas